Mapping Segregation in Westchester
Westchester County recently settled a lawsuit over its failure to promote integration under the 1968 Fair Housing Act. The split map below shows two Westchesters. Slide the handle to the right to see African-American households as they are today, and to the left to see where they'd be if African-American households were located near white households of the same income. Related Story »
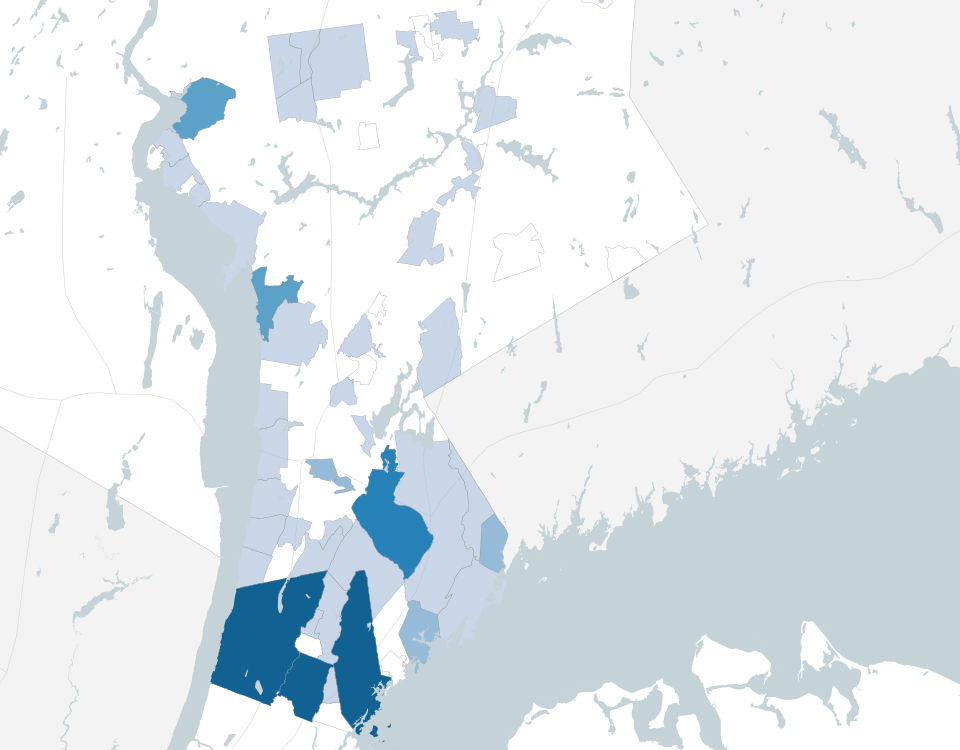
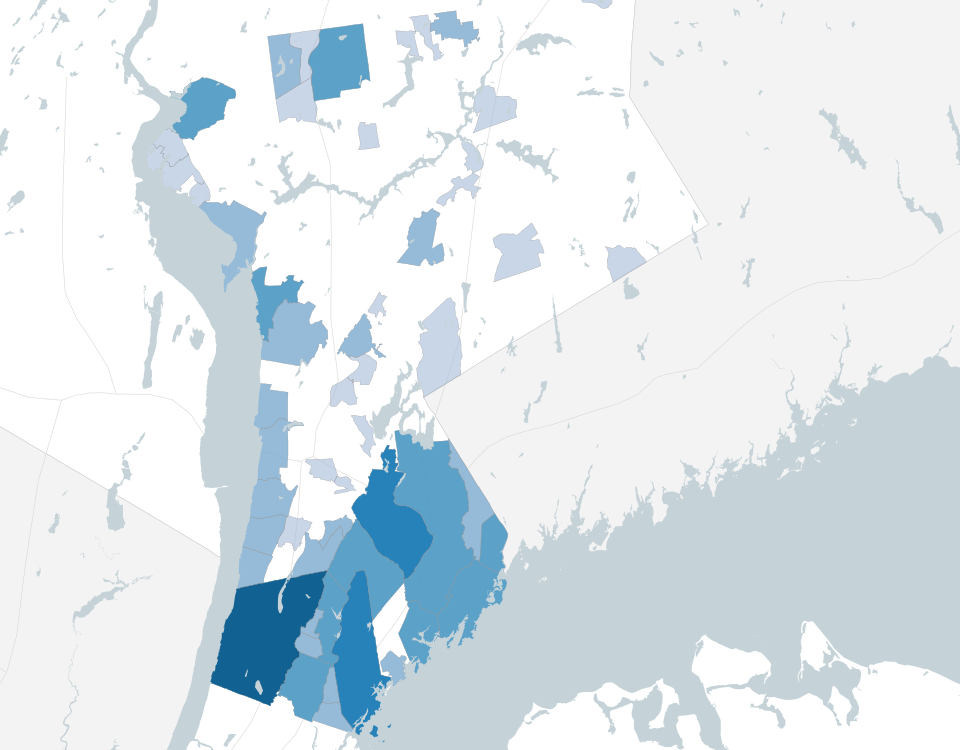
African Americans are 60 percent of Mount Vernon’s households. If African Americans lived in areas with whites of the same income, they would makeup just six percent.
Scarsdale was to build 160 affordable housing units by 2015 according to a countywide plan unrelated to the housing settlement. It has built zero.
African American Households
0 - 353
354 - 818
819 - 1805
1806 - 4170
4170+
Affordable housing units
Show completed affordable housing units since 1992
Show units developed under the settlement
| Place | African American Households | African Americans Households based on income |
|---|---|---|
| Mount Vernon | 15617 (±505) | 1696 (±885) |
| Yonkers | 13986 (±701) | 9646 (±869) |
| Harrison | 29 (±33) | 1805 (±461) |
| Eastchester | 43 (±42) | 1788 (±446) |
| Rye | 11 (±19) | 1233 (±477) |
| New Rochelle | 5368 (±485) | 4170 (±547) |
| Scarsdale | 65 (±39) | 1149 (±428) |
| Jefferson Valley-Yorktown | 174 (±102) | 1226 (±383) |
| Mamaroneck | 426 (±168) | 1310 (±354) |
| Dobbs Ferry | 89 (±59) | 818 (±394) |
| Rye Brook | 56 (±35) | 758 (±428) |
| Hastings-on-Hudson | 31 (±26) | 678 (±427) |
| Pleasantville | 24 (±42) | 657 (±462) |
| Croton-on-Hudson | 49 (±37) | 675 (±428) |
| Heritage Hills | 27 (±30) | 595 (±461) |
| Bronxville | 0 (±123) | 547 (±492) |
| Peekskill | 1654 (±255) | 1115 (±293) |
| Irvington | 54 (±68) | 578 (±465) |
| Mount Kisco | 223 (±115) | 747 (±410) |
| Briarcliff Manor | 64 (±43) | 582 (±391) |
| Fairview | 505 (±113) | 23 (±112) |
| Larchmont | 0 (±123) | 466 (±443) |
| Tarrytown | 338 (±139) | 771 (±351) |
| Lake Mohegan | 45 (±54) | 476 (±447) |
| Port Chester | 800 (±187) | 1226 (±328) |
| Greenville | 45 (±70) | 448 (±449) |
| Pelham Manor | 0 (±123) | 394 (±443) |
| Hartsdale | 187 (±111) | 507 (±403) |
| Ardsley | 24 (±23) | 307 (±444) |
| Armonk | 9 (±16) | 285 (±461) |
| Sleepy Hollow | 157 (±79) | 418 (±337) |
| Hawthorne | 96 (±93) | 353 (±454) |
| Thornwood | 0 (±123) | 241 (±476) |
| Elmsford | 410 (±105) | 188 (±291) |
| Valhalla | 20 (±24) | 238 (±444) |
| Pelham | 239 (±92) | 456 (±421) |
| Montrose | 23 (±35) | 237 (±445) |
| Ossining | 952 (±197) | 1160 (±230) |
| Buchanan | 27 (±29) | 188 (±445) |
| Peach Lake | 0 (±123) | 160 (±460) |
| Shenorock | 14 (±23) | 173 (±461) |
| Bedford Hills | 82 (±57) | 230 (±413) |
| Crompond | 14 (±21) | 160 (±427) |
| Tuckahoe | 291 (±166) | 434 (±455) |
| Crugers | 20 (±23) | 160 (±460) |
| Yorktown Heights | 0 (±123) | 136 (±408) |
| Bedford | 0 (±123) | 136 (±369) |
| Shrub Oak | 27 (±31) | 150 (±390) |
| Lincolndale | 0 (±123) | 117 (±389) |
| Golden's Bridge | 25 (±29) | 141 (±390) |
| White Plains | 3463 (±351) | 3370 (±432) |
| Chappaqua | 0 (±123) | 87 (±369) |
| Katonah | 24 (±33) | 101 (±390) |
| Verplanck | 0 (±123) | 65 (±348) |
| Scotts Corners | 0 (±123) | 56 (±275) |
(Source: ACS 5-year estimates, Census Designated Places)