From https://projects.propublica.org/docdollars. © Copyright 2013 Pro Publica Inc.
ViiV
ViiV was created in 2009 to manage the HIV/AIDS medications of GlaxoSmithKline and Pfizer. It was joined in 2012 by drugmaker Shionogi. Glaxo has an 76.5 percent ownership interest, Pfizer 13.5 percent and Shionogi 10 percent. Like Glaxo, ViiV is based in the United Kingdom, with U.S. headquarters in Research Triangle Park, N.C.
ViiV reports payments made to physicians for speaking and consulting beginning in January 2010. In 2010, it began reporting research payments in a separate report. In the fourth quarter of 2012, ViiV began reporting business meals and business travel.
ViiV's 2013 U.S. sales: $1 billion. Source: IMS Health.
See all ViiV payments, or visit ViiV's transparency page.
Notable drugs
Payment Reports
2010 Jan. to Dec.
| Avg. Quarterly | Total | |
|---|---|---|
| Speaking | $993,776 | $3,975,102 |
| Consulting | $89,438 | $357,750 |
| $1,083,213 | $4,332,852 |
2010 Jan. to Dec. Research
| Avg. Quarterly | Total | |
|---|---|---|
| Research | $877,783 | $3,511,131 |
| $877,783 | $3,511,131 |
2011 Jan. to Dec.
| Avg. Quarterly | Total | |
|---|---|---|
| Speaking | $722,846 | $2,891,383 |
| Consulting | $57,034 | $228,135 |
| $779,880 | $3,119,518 |
2011 Jan. to Dec. Research
| Avg. Quarterly | Total | |
|---|---|---|
| Research | $1,425,170 | $5,700,681 |
| $1,425,170 | $5,700,681 |
2012 Jan. to Sept.
| Avg. Quarterly | Total | |
|---|---|---|
| Speaking | $547,283 | $1,641,850 |
| Consulting | $15,500 | $46,500 |
| $562,783 | $1,688,350 |
2012 Jan. to Dec. Research
| Avg. Quarterly | Total | |
|---|---|---|
| Research | $2,603,623 | $10,414,491 |
| $2,603,623 | $10,414,491 |
2012 Oct. to Dec.
| Avg. Quarterly | Total | |
|---|---|---|
| Speaking | $409,100 | $409,100 |
| Meals | $47,107 | $47,107 |
| Travel | $32,941 | $32,941 |
| Consulting | $4,800 | $4,800 |
| $493,948 | $493,948 |
2013 Jan. to Dec.
| Avg. Quarterly | Total | |
|---|---|---|
| Speaking | $265,748 | $1,062,993 |
| Meals | $73,784 | $295,138 |
| Consulting | $57,438 | $229,750 |
| Travel | $47,937 | $191,748 |
| Other | $270 | $1,081 |
| Adjustment | -$21 | -$86 |
| $445,156 | $1,780,624 |
2013 Jan. to Dec. Research
| Avg. Quarterly | Total | |
|---|---|---|
| Research | $1,900,713 | $7,602,854 |
| $1,900,713 | $7,602,854 |
Total Payments by State
| State | Total |
|---|---|
| California | $6,592,067 |
| Texas | $5,473,810 |
| New York | $4,427,309 |
| Florida | $4,233,574 |
| North Carolina | $1,578,373 |
| Maryland | $1,490,871 |
| Georgia | $1,378,316 |
| Minnesota | $1,345,816 |
| Kansas | $1,069,411 |
| District of Columbia | $1,014,013 |
| Illinois | $908,065 |
| Colorado | $861,457 |
| Pennsylvania | $860,445 |
| New Jersey | $596,192 |
| Alabama | $564,270 |
| Missouri | $541,904 |
| Ohio | $541,224 |
| Michigan | $442,821 |
| Puerto Rico | $427,241 |
| Arizona | $416,252 |
| Massachusetts | $414,959 |
| Connecticut | $348,964 |
| Rhode Island | $331,633 |
| Virginia | $287,556 |
| Iowa | $251,453 |
| South Carolina | $245,047 |
| Washington | $234,832 |
| Nevada | $212,531 |
| Oregon | $196,628 |
| Nebraska | $191,296 |
| Tennessee | $168,727 |
| Arkansas | $165,005 |
| North Dakota | $155,302 |
| Wisconsin | $155,018 |
| Indiana | $144,232 |
| Louisiana | $94,309 |
| Utah | $72,977 |
| Idaho | $67,942 |
| Mississippi | $36,971 |
| Hawaii | $35,177 |
| Oklahoma | $24,370 |
| Kentucky | $16,675 |
| New Mexico | $16,640 |
| Maine | $5,632 |
| West Virginia | $4,681 |
| New Hampshire | $2,219 |
| Delaware | $217 |
| Vermont | $28 |
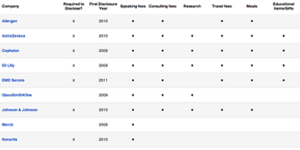
What Companies Disclose
See which services pharmaceutical companies report paying health practitioners for.
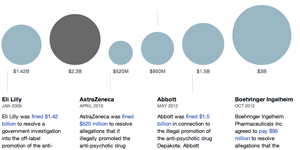
Big Pharma’s Big Fines
Drug companies have paid billions to the Department of Justice to resolve allegations of health care fraud. See some of the biggest settlements.