ProPublica Data Institute 2017
An intensive workshop on how to use data, design and code for journalism. From June 7th to 21st in New York City.
Our Materials
Here are all of the materials we used to teach the 2017 ProPublica Data Institute: slides, exercises, links, and homework. This is not an online course and doesn’t have all the context or instruction to be a standalone class. However, we’re working on creating one. Sign up here to be notified of any updates to these materials, as well as any announcements about future workshops.
Want to use our slides? Our teaching materials fall under the same Creative Commons license we use across our site. Get more details here.
Curriculum
Welcome: June 6, 2017
Welcome Reception & Install Party
Accounts
- Github.com
(Make sure to confirm your e-mail address) - Google.com
Software
- Google Chrome
- Slack (Mac, Windows)
- Sublime Text (Mac, Windows)
- Github Desktop App
- Tabula (Mac, Windows)
- Open Refine (Mac, Windows)
Macs
- Open your Terminal app (comes with all Macs) and paste this exact command into the window and press enter:
- xcode-select --install
-
python -V
- Your Terminal should say something like "Python 2.7.13". Your last two digits might be different, that's okay. If you get something that Python 3, which looks like: "Python 3.X.XX" let Sisi know.
- sudo easy_install pip
- sudo pip install BeautifulSoup
- sudo pip install Requests
Windows
- Download Cygwin
- When you get to this step, ask for Sisi
Day 1: June 7, 2017
Intro to Data Journalism
Intro to Spreadsheets

Exercises
- Organizing information in rows & columns using Senate data
- Learning how to sort with Trump expenditures
Where to Find and Load Data

In-Class Demos
- Using Socrata to look at 3-1-1 calls from NYC
- Tabula
- Types of data (numeric, text, date)
- Quirks of Excel (reformatting dates, dropping leading zeros)
- Text files and types (csv, tab, fixed width, pipe)
- Text delimiter (probably quotes, but maybe not)
- Open your text file in a reader and examine it
Best Practices
In-Class Demos
- Create a text document
- Save a clean copy of your data
- Keep track of your work
- Describe your steps
- Copy/paste functions
- Screen grabs of dialogue boxes

Homework
- None! Enjoy the city!
Day 2: June 8
Advanced Spreadsheets: Pivot Tables
Exercises
- What are pivot tables
- How to copy and move them
Evaluating Data
Exercises
- Fairfax County Arrest data
- Look for missing values
- Look for out of range values
- Look at all the values that appear in a column/row
- Look for truncation
- Pivot - look for similar names
Data Integrity
Exercises
- Whack Test Scores
Open Refine

In-Class Demos
- Download a copy of this data
- Efficiently fix common data problems
- Data clustering with Open Refine
Analyzing Data: One Variable
Exercises
- Practice Data
- Different distribution shapes
- Summary statistics
Analyzing Data: Two Variables

Exercises
- Cartesian coordinate review
- Correlation
- Scatterplots
- Percent Change
Homework
- Download this practice dataset of how much doctors in Belleville, Ill. are being paid by pharmaceutical companies. Familiarize yourself with the dataset based on what you've learned in the past two days. Then, find at least three errors or strange anomalies (there are more than 10 in the dataset). Come prepared tomorrow to discuss what you found.
Day 3: June 9
Statistical Tests
In-Class Demo
Homework
- Collect all the information that they would include on their resume/website. Put all the text you'll need into one google document, and all the art/photos etc in a folder.
- For your resume:
- Basic info, experience, education, skills, etc.
- For your portfolio:
- Pick what kinds of things you want to show up: article links vs. video vs. audio. Have at minimum, five things ready, if not more.
- For each item in your portfolio, have ready:
- The link
- Any art/photo if applicable
- Short description of what you did for that project
- Finally, also have general "About Me" information ready, such as how can someone contact you? Do you have a photograph of yourself that you'd like to use?
Day 4: June 12
Intro to Code
In-Class Demos
- What coding languages have you heard of?
- Using the web inspector
How Websites Work
In-Class Demos
- How the Internet passes websites around
- What HTML, CSS and Javascript contribute to a webpage
Exercises
- Drawing a Website
HTML

In-Class Demos
- How to create your first HTML file
- Shortcut to the basic HTML template
- How to use:
- <h1>
- <h2>
- <h3>
- <p>
- <img>
- <a>
- <ul>
- <!-- Comments -->
Exercises
- Copy and paste this code and follow the instructions inside to format the page.
- Can you fix this broken code?
Basic CSS
In-Class Demos
- How to create your first CSS file
- Shortcut to linking to your CSS file
- How CSS styles work
Exercises
- Using your practice HTML file from before, add CSS styles to it such you change the:
- color
- font-family
- font-size
- On your own, look up how to do the following in CSS, and add it to your HTML file as well:
- underline text
- bold text
- italicize text
- Going back to the Supreme Court article you formatted earlier, do the following using CSS:
- Make the main headline dark red.
- Use the font family "Georgia" for the main headline and the subheadline.
- Center the text of the main headline and the subheadline.
- Give the paragraphs a line height of 19 pixels.
- Remove the underline from the links.
- Make the "Related articles" label all uppercase.
- Bonus: Make an underline appear when you hover over a link.
CSS Classes
In-Class Demos
- How to write your own CSS Class
- How CSS deals with conflict
Homework
- Save this HTML onto your computer. Link to a new CSS file that you create. Write CSS to make the end result look like this image. You may only write CSS. You cannot edit the HTML file.
- Using HTML, CSS, and the information you gathered over the weekend, lay out a one-page web portfolio for yourself. Don't worry too much about the final design, just make sure to get all of your information on the page and formatted using HTML.
Day 5: June 13
Intro to Design Principles

Lecture
- What's Design Anyways?
- Design Principles: The Only 4 Rules You Gotta Know
- Details: The Real Secret of Good Design
Exercises
- Align This!
- Resume Redesign
Type, Layout & Color

Lecture
- Letter: The Many Faces of Type
- Text: How to Deal with Words
- The Grid: Putting the Pieces Together
- Colors & How to Pick 'Em
Exercises
- Name that Font!
- Type Crimes
CSS Layout: Floats and Box Model
Quick Review
- Review of Day 3 using the Paper Code exercise
- Mars Rover exercise solution.
In-Class Demos
- Why the Internet is just a bunch of boxes
- How floats work
- Clearfix demo
- How the box model works
Exercises
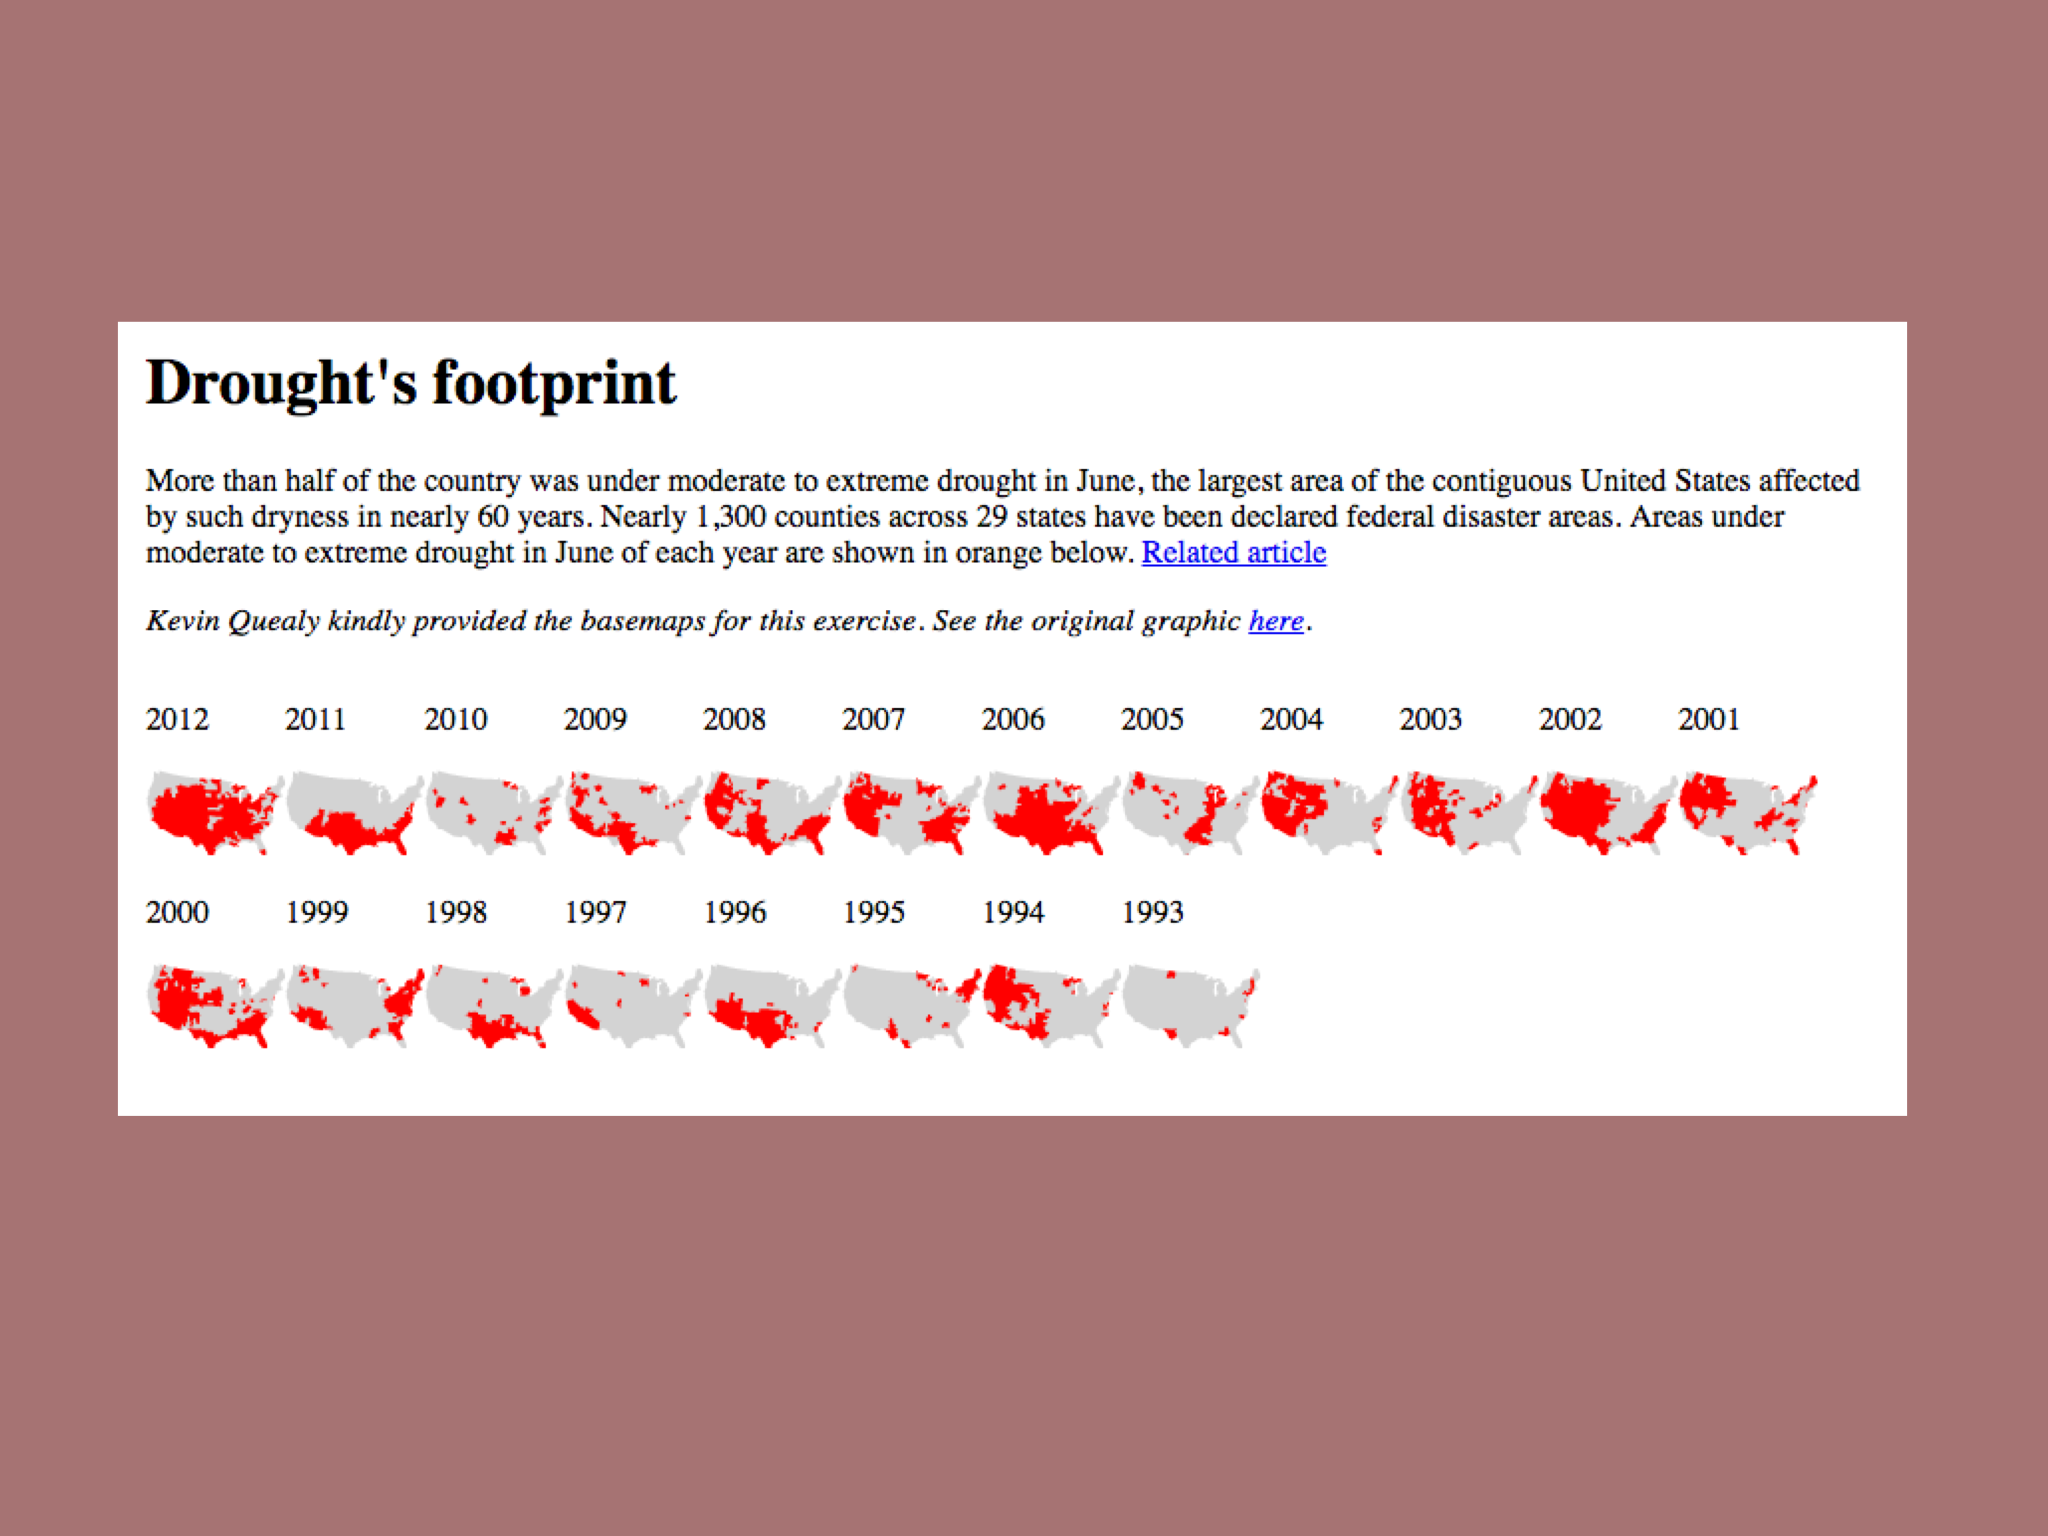
- Save this code onto your computer.
- Floats: Write CSS so that the drought graphic looks like this.
- Box Model: Write additional CSS so that the drought graphic looks like this.
Homework
- Using the principles we discussed today, redesign your résumé. Email the before and after version to [email protected].
- Using everything you've learned already with CSS, floats and the box model, start styling your portfolio.
Day 6: June 14
CSS Layout: Positioning
In-Class Demos
- How positioning works
Exercises
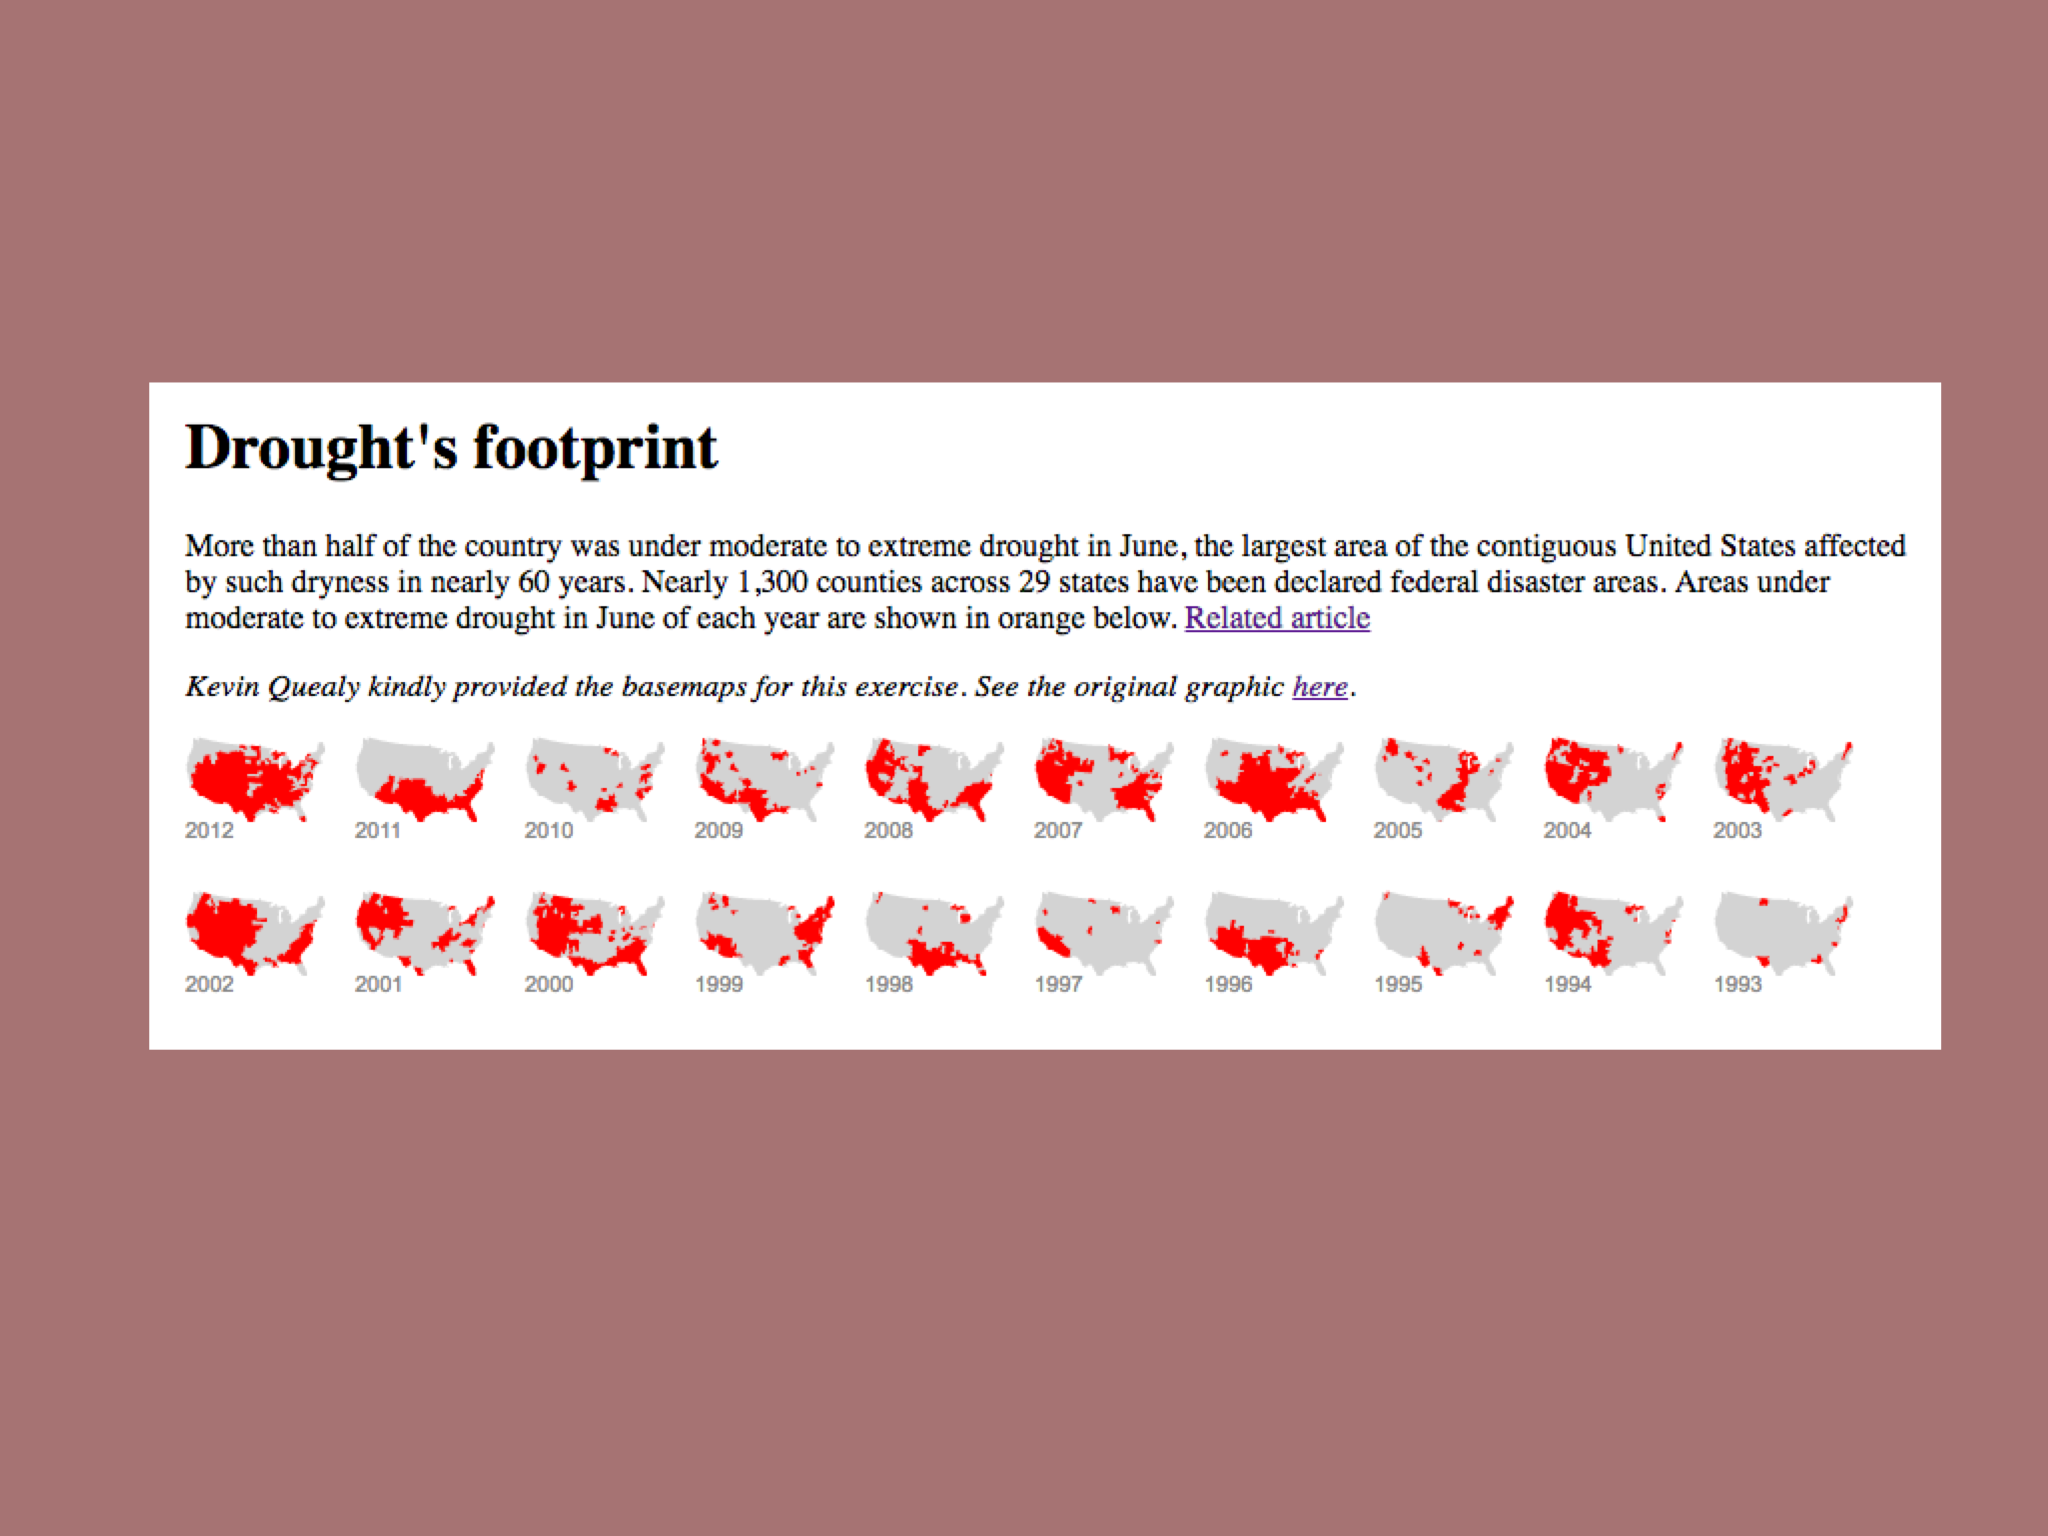
- Save this code onto your computer.
- Using CSS positioning, bring the drought graphic home by making it look like this. You've made a graphic!
Let's make a webpage in Github!

In-Class Demo
- Making a website
- Getting your portfolio on the internet!
Homework
- Keep working on your portfolio, now that you have even more CSS skills.
- Update your portfolio on Github with your latest progress.
Day 7: June 15
Javascript
In-Class Demos
- How to setup Javascript
- How to add jQuery, set it up, and use it (A good place to review what we're learning)
- Ida Demo: Starting with this HTML and CSS, let's build the JS together.
Exercise
- Save this code onto your computer as separate HTML and CSS files. Create a new JS file and link to it in your HTML.
- Let's talk through logically, what needs to happen together.
- Can you figure out how to build a before and after graphic using Javascript?
Homework
- Using your own photos, make your own before and after interactive. Then, publish your interactive on Github and add it to your portfolio.
- Sign up for an account on datawrapper.de
Day 8: June 16
Visualizing Data

Lecture
- Lines
- Bars
- Scatterplots, Treemaps & More!
Let's Make Some Charts & Maps!

In-Class Demo
- From data to charts in Google Sheets & Data Wrapper
Exercises
- Download this folder full of data
- Make a chart in Datawrapper
- Make a map in Datawrapper
Homework
- Make a chart or map using a dataset of your choosing with Datawrapper (make sure to give your graphic a title and description). Add it to a webpage and put it up on Github. Send the url of your published webpage to [email protected]
- We'd like to pair your headshots with 1-2 sentences from you about the Data Institute so far (if you've gotten anything useful from it, what your favorite part has been, the most exciting thing you've learned, etc). Please email your quote to [email protected]. Note: we'd love to publish your headshot/quote on our social channels, but if you'd prefer we didn't, that's fine. Just let us know.
Day 9: June 19
Web Scraping
In-Class
- Introduction to Web Scraping
- Thinking through how to scrape this website
- Download and unzip this folder into your "Code" folder on your computer
- Fundamentals of Programming
- Want to review later? Everything we're covering is laid out here.
Exercises
- Write a function, named copycat, that simply prints out whatever input it's given.
- Write a function, named addition, that when given any three numbers, will print out the total sum of all three numbers.
- Write a function, named conversion, that when given the Fahrenheit temperature, will print out what it is in Celsius. The formula you can use is: C = (F – 32) * 5/9
- Write a function, named find_the_max, that given any three numbers, will print out the bigger number. Python has the native ability to do this, using the function max(). Do not use it. Instead write this from scratch.
- For an extra challenge: Given the following data, write a function, named total_students, that calculates how many total students are enrolled in Hogwarts.
pupils_by_year = [["first years", 40], ["second years", 40], ["third years", 38], ["fourth years", 35], ["fifth years", 30], ["sixth years", 29], ["seventh years", 23]]
Homework
- Keep working on your portfolios and presentations.
- See if you can write yourself any other functions. It'll help you gear up for tomorrow.
Day 10: June 20
Web Scraping
In-Class
- Even more web scraping!
Homework
- Prepare your presentation for tomorrow! Send a URL of the project you want to show to [email protected] by tomorrow at 9:30am. Here are some questions to think about:
- General: What did you learn? What can you do now that you could not do 2 weeks ago? What were the biggest challenges/setbacks/frustrations you faced? The biggest surprises/succeses/most awesome things you accomplished?
- Project specific: Tell us what you’re presenting: your portfolio, a dataset you analyzed, a data visualization you created. What are you proud of? What are the next steps you want to take? What are your ultimate goals for the project?
Day 11: June 21
Final Presentations!
Meet the Class of 2017
We're thrilled to announce the 12 outstanding journalists who will be joining us for the ProPublica Data Institute this year. Find out more about the Data Institute »

Andrew Wang (@andrew_L_wang) is a small-business writer at NerdWallet. He’s been a reporter for 11 years and has worked at the Chicago Tribune and Crain’s Chicago Business. He is also a graduate of the Minority Editorial Training Program at the Los Angeles Times. Andrew has a bachelor’s in mechanical engineering from Duke University, a master’s in journalism from Northwestern University and an MBA, also from Northwestern. He lives in Pasadena, Calif.

April Ehrlich (@AprilEhrlich) covers city government, housing and homelessness in southwestern Oregon for The News-Review. She focuses on in-depth enterprise pieces that investigate poverty in rural Oregon while also producing daily updates on local government policies. She previously covered Idaho's new oil and gas industry and studied the energy industry as a fellow with the Institute for Journalism and Natural Resources. She spends her free time reporting for Jefferson Public Radio, hiking through nearby forests with a rambunctious border collie, and reading fiction at home with her two favorite cats.

April Joyner (@aprjoy) is a writer and editor fascinated by the intersection of business, technology and culture. She writes regularly for Technical.ly Brooklyn and has also contributed to Fast Company, Marie Claire, The New Yorker, OZY, and The Week. Before beginning her freelance career, she was a senior reporter at Inc. She lives in Brooklyn, New York, but remains a Virginian at heart.

April Simpson (@aprilleticia) is the associate editor of Current where she reports on funding and innovation in public media. Prior to moving to Washington, D.C., April was a South-Florida-based journalist, a web producer for the Seattle Times and a reporter for the Boston Globe. April has reported from the Democratic Republic of Congo on a fellowship with the International Women's Media Foundation. She has also reported from Botswana on a Fulbright fellowship. April earned her B.A. from Smith College and MSc from the London School of Economics and Political Science.
Ellis Simani (@emsimani) is an aspiring journalist and developer from Seattle, Washington. A recent graduate of Claremont McKenna College, Ellis spent his time outside of the classroom reporting for the South Seattle Emerald and serving as a Digital Scholarship Fellow within the Claremont University Consortium’s Digital Humanities initiative. Ellis appreciates data for its utility in telling stories, but is inspired by its ability to encourage political participation and empower individuals to make informed decisions. When not in front of a computer screen, Ellis prioritizes spending time in libraries or traveling long distances on bicycles. This summer he’ll be joining The Seattle Times as the paper’s Digital and Interactives intern.

Julieta Rodrigo (@juliveandlearn) is a recent graduate from Florida International University, with Bachelor’s degrees in Political Science and International Relations. Born in Buenos Aires and raised in Miami, Florida, she has been surrounded by multiculturalism all of her life. She previously interned in the International News department at Telemundo, co-hosted a radio show in Spanish during her student exchange program in Argentina, and wrote for her university’s newspaper, Panther Press. After the Data Institute, she will pursue a journalism career, with a concentration in politics and foreign affairs.
Kasha Patel (@KashaPatel) is an Earth science writer at NASA’s Goddard Space Flight Center covering topics from the latest research about hurricanes to the unique applications of satellite data in emergency response, agriculture, and citizen science. She hosted a NASA mini TV/web series called "Earth Expeditions" that highlighted how NASA studies Earth with boats, airplanes, and even dog sleds. She is also a stand-up comic and specializes in science jokes, producing Science Comedy shows where only science jokes are allowed. She studied chemistry at Wake Forest University and earned her M.S. in Science Journalism from Boston University. She will also be happy to play a game of Ultimate frisbee with you.

Mike Finch (@Mike_Finch2) covers health care and medicine for the Daytona Beach News-Journal in Florida. He previously worked as a business reporter in Mobile, Ala. at the Press-Register and AL.com. Mike was a reporting intern at the Miami Herald, Tampa Bay Times and the Palm Beach Post. He studied political science at Florida International University. Mike is this year's Ida B. Wells Society fellow.

Meredith Clark (@meredithclark) will join the faculty at the University of Virginia in the Department of Media Studies in the fall of 2017. She was an assistant professor of digital and print news in the Mayborn School of Journalism at the University of North Texas from 2014 to 2017. Her research on Black Twitter landed her a spot on The Root 100 list of the country's most influential African Americans in 2015. Prior to pursuing a career in academia, she worked as a reporter, editor and columnist for papers including the Raleigh News & Observer and the Tallahassee Democrat. She's currently conducting research on the online news and commenting experiences of women and nonbinary people of color, and the retention and recruitment of people of color in U.S. newspaper newsrooms.

Sandra Gomez-Aceves (@SanGomez_News) is a breaking news reporter at the Hartford Courant. She has a B.S. in Journalism with a concentration in political science from Southern Connecticut State University, where she graduated with honors earlier this year. While in college she interned at her hometown newspaper, The Record-Journal and was the News Director for SCSU TV, the campus television station. Sandra aspires to become a do-it-all journalist.

Tasnim Shamma (@TasnimS) is the economy and innovation reporter at the National Public Radio member station WABE in Atlanta, where she covers technology and business. Prior to joining WABE in 2014, she was a Kroc fellow at NPR and then spent two years at WFAE in Charlotte, covering criminal justice and hosting a podcast called ‘A Trifling Place’ about the city’s history and Southern culture. She grew up in Queens and graduated from Princeton's Class of 2011, where she was executive editor for multimedia at The Daily Princetonian. She helps direct and is a proud alumna of the Princeton Summer Journalism Program for low-income high school students, which is focused on diversifying college and professional newsrooms.

Yezmin Villarreal (@YezYes) is news editor at The Advocate, where she covers LGBT news and politics. She is interested in learning how to use data, coding, and design to do investigative stories about LGBT people and the issues they are affected by. She is particularly interested in studying how the LGBT community is being treated under the Trump administration.
Code of Conduct
1. Purpose
ProPublica believes the Data Institute should be truly open for everyone. As such, we are committed to providing a friendly, safe and welcoming environment for all, regardless of gender, sexual orientation, disability, ethnicity or religion.
This code of conduct outlines our expectations for participant behavior as well as the consequences for unacceptable behavior.
We expect all of our instructors and students to help us create a safe and positive workshop for everyone.
2. Expected Behavior
Be considerate, respectful, and collaborative.
Refrain from demeaning, discriminatory or harassing behavior and speech.
Be mindful of your surroundings and of your fellow participants. Alert the Data Institute organizers if you notice a dangerous situation or someone in distress.
3. Unacceptable Behavior
Unacceptable behaviors include: intimidating, harassing, abusive, discriminatory, derogatory or demeaning conduct by anyone participating in the Data Institute.
Harassment includes: offensive verbal comments related to gender, sexual orientation, race, religion, disability; inappropriate use of nudity and/or sexual images in public spaces (including presentation slides); deliberate intimidation, stalking or following; harassing photography or recording; sustained disruption of talks or other events; inappropriate physical contact, and unwelcome sexual attention.
4. Consequences of Unacceptable Behavior
Unacceptable behavior will not be tolerated whether by instructors, students or ProPublica staff.
Anyone asked to stop unacceptable behavior is expected to comply immediately.
If someone engages in unacceptable behavior, the Data Institute organizers may take any action we deem appropriate, up to and including discontinuation of any stipends and expulsion from the Institute.
5. What to Do If You Witness or Are Subject to Unacceptable Behavior
If you are subject to unacceptable behavior, notice that someone else is being subject to unacceptable behavior, or have any other concerns, please notify a Data Institute organizer as soon as possible.
The Data Institute organizers will be available to help participants contact building security or local law enforcement, to provide escorts, or to otherwise assist those experiencing unacceptable behavior to feel safe for the duration of the Institute.
Special thanks to the Portland Tech Workshops for creating their Code of Conduct and licensing it under Creative Commons Attribution-ShareAlike.