
To See How Levees Increase Flooding, We Built Our Own
To See How Levees Increase Flooding, We Built Our Own
Levees — massive earthen or concrete structures that keep rivers confined to their channels — tame the flow of rivers and make life possible for the millions of people who live behind them. But they come with often-unexamined risks, as they can make floods worse for the communities across the river or upstream from them.
Related story: Flood Thy Neighbor: Who stays dry and who decides?
This is well-known to scientists and supported by basic physics, but we wanted to see it for ourselves. So, instead of waiting for a huge flood, we built our own.
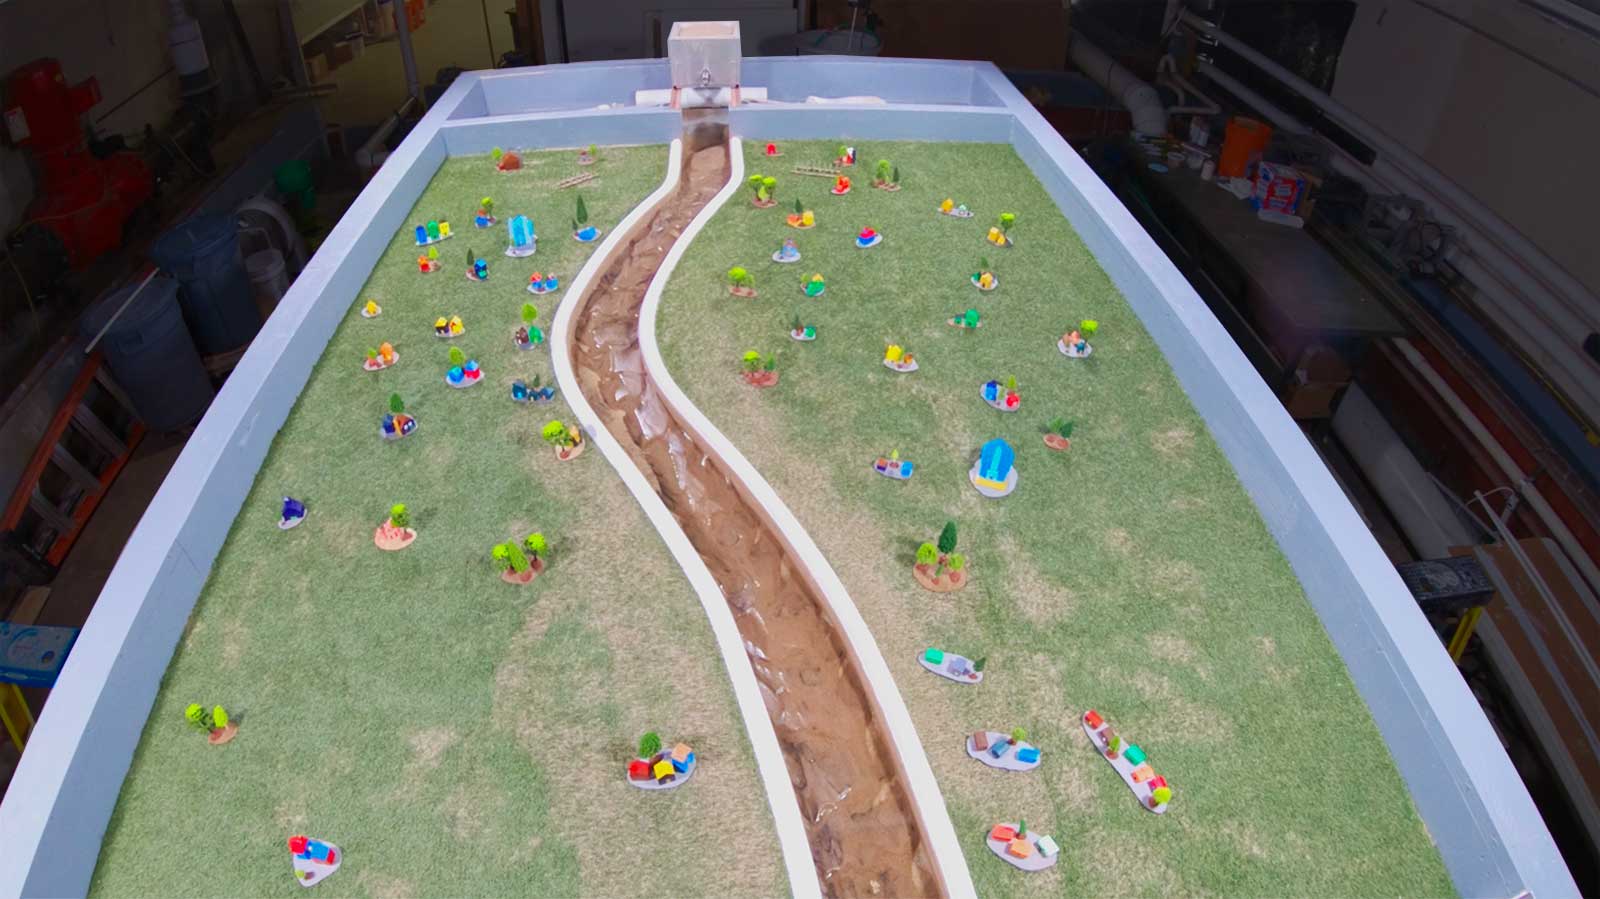
ProPublica and Reveal from The Center for Investigative Reporting hired engineers at the St. Anthony Falls Laboratory at the University of Minnesota in Minneapolis to build a physical model of four levee scenarios to see how levee height and placement choices can put surrounding communities on the floodplain — the low-lying land near river channels — at greater risk of flooding.
We piped Mississippi River water in from here
This box deposited a constant rate of sediment into the channel
PVC levees
Artificial turf floodplain
Houses painted by ProPublica staff
Water exited through a slot here
Extra levees
The St. Anthony Falls Laboratory was built into the banks of the Mississippi River near downtown Minneapolis in 1938. Since then researchers there have used it to study rivers, constructing large, elaborate physical models that make use of the Mississippi itself.
One of the SAFL engineers, Robert Gabrielson, built a working model of a river in a 10-foot by 13-foot box with an artificial turf floodplain and a miniature river channel running down the center. He made the levees out of PVC trim — flexible, plastic strips — and piped actual Mississippi River water through the channel, along with a steady supply of sediment.
He adjusted the water’s flow rate to simulate normal river conditions as well as floods. The lab is equipped with sophisticated scanners that record high-resolution elevation and water surface data. We added tiny wooden houses to represent communities on the floodplain. Though the model isn't to scale, nor a scientific study, it effectively simulates the basic physics of the conditions facing many of the people who live near the nation's 100,000 miles of levees.
The four river scenarios we modeled were: no levees; two levees of the same height on both sides; a higher levee on one side than the other; and a single "setback" levee, built further back, which preserves some of the natural floodplain.
For each scenario, we gradually increased the flow rate of the water running through the channel — from 50 gallons per minute to almost 200 gallons per minute in some scenarios.
Use the buttons below to see what happens as the flow increases.
Use buttons above to adjust water flow rate through the channel
Swipe to explore levee scenarios
No Levees
When a free-flowing river floods, water jumps the river's banks and flows onto the floodplain.
Equal-Height Levees
When rivers have similar terrain on both sides, equal-height levees keep both banks dry.
Unequal-Height Levees
When one levee is taller than the other, or when people overbuild their levees, the extra height — ¼-inch in our model — is enough to shift some large floods to the other side of the river. See it yourself by turning up the flow rate of the water to 140 gallons per minute.
Setback Levees
Setback levees are built further back, allowing part of the natural floodplain to flood. This lowers water heights while still protecting areas behind the levees, and pushes less water upstream. Setback levees are common in the Netherlands but still rare in the U.S.
Just like in the real world, when we added levees to the model, water ran faster and higher when trapped between levees. When people on one side of the river raise their levees, they can push a wall of water onto their neighbors across the river. The people with the lower levee often have no recourse but to try to build up their own defenses.
What Happens in the Real World
The model we built in Minnesota showed a few simple examples of what could happen when people live near levees. But what do the effects look like in the real world?
Two university researchers did a study of the effects of levees in 2011. Reuben Heine of Augustana College in Rock Island, Illinois, and Nicholas Pinter at the University of California-Davis looked at 13 levees in Illinois and Iowa. Every levee they studied increased flooding across the river or upstream—sometimes by up to five feet.
Heine and Pinter proved what many scientists consider to be basic physics: during a flood, extra water always has to go somewhere. If a river has levees on only one side, some water is pushed across the river, flooding unprotected areas even more. But if a river has levees on both sides, the water between the levees piles up. In both cases, the water backs up, adding extra risk to nearby unprotected land upstream of the levee.
Scientists consider it a given that levees make flooding worse. It’s mentioned in Earth Science 101 textbooks, said Anne Jefferson, a geology professor at Kent State University. “It’s not terribly difficult to work out what happens when you’re squeezing things along a nozzle.”
Fredrik Huthoff, an engineering consultant in the Netherlands who specializes in flooding and river science, compared this to a traffic jam: River water backs up behind the bottleneck caused by the levees.
A Watery Traffic Jam
A 2011 study of levee systems in Iowa and Illinois found three broad patterns in how levees affect flood levels. Upstream from levees, water levels rise, sometimes sharply, while downstream, heights drop slightly.
A Upstream of Levee
Because levees constrain rivers, water heights upstream of levees rise higher than they would without levees. One engineer compared it to a traffic jam.
B Alongside the Levee
When the river floods, water heights alongside levees are pushed even higher than those upstream.
C Downstream of Levee
Downstream of a levee, water heights are a little lower because the water moves faster after being squeezed through levees.
Source: Heine/Pinter, 2011
Heine and Pinter only looked at 13 levees because there isn’t enough good data. Heine told us that although they started with 203 possible sites to study, they had to throw out nearly all of them because the government-funded stream gauges necessary to study levees weren't collecting enough data, or weren't in place before the levees were built, or weren't in the right place in the river relative to levees. Still, in the 13 cases that were usable, the pattern was clear.
After Levees Were Built, Floods Got Worse on the Wabash River Near Mt. Carmel, Illinois
Source: US Geological Survey. Note: Water height is measured in feet from the gauge elevation.
To rule out other reasons why water levels might rise — such as a landslide or extra sediment that might have raised the bottom of the river channel — Heine and Pinter also looked at gauge data from when the river is flowing, but not flooding. In these cases, they found no differences in pre- and post-levee water levels.
Jonathan Remo, a Southern Illinois University professor who studies flooding in the Midwest, told us he wasn't surprised by Heine and Pinter's study, since it confirms what's been shown through computer modeling, and echoes decades of research on how levees and other engineering projects have aggravated flooding, particularly along the Mississippi River.
Among the most striking examples Heine and Pinter found was in the gauge data near Mt. Carmel, a southern Illinois town just across the Wabash River from Indiana. The Army Corps built levees on both sides of the river near the town in the late 1960s. Heine and Pinter found that the two levees constricted the Wabash floodplain and forced water levels nearly three feet higher than they would have been for a minor flood, the kind of flood that has a 10 percent chance of occurring in a given year. Most of that water was pushed upstream of the pinch point into the area where the Wabash meets the White River nearby.
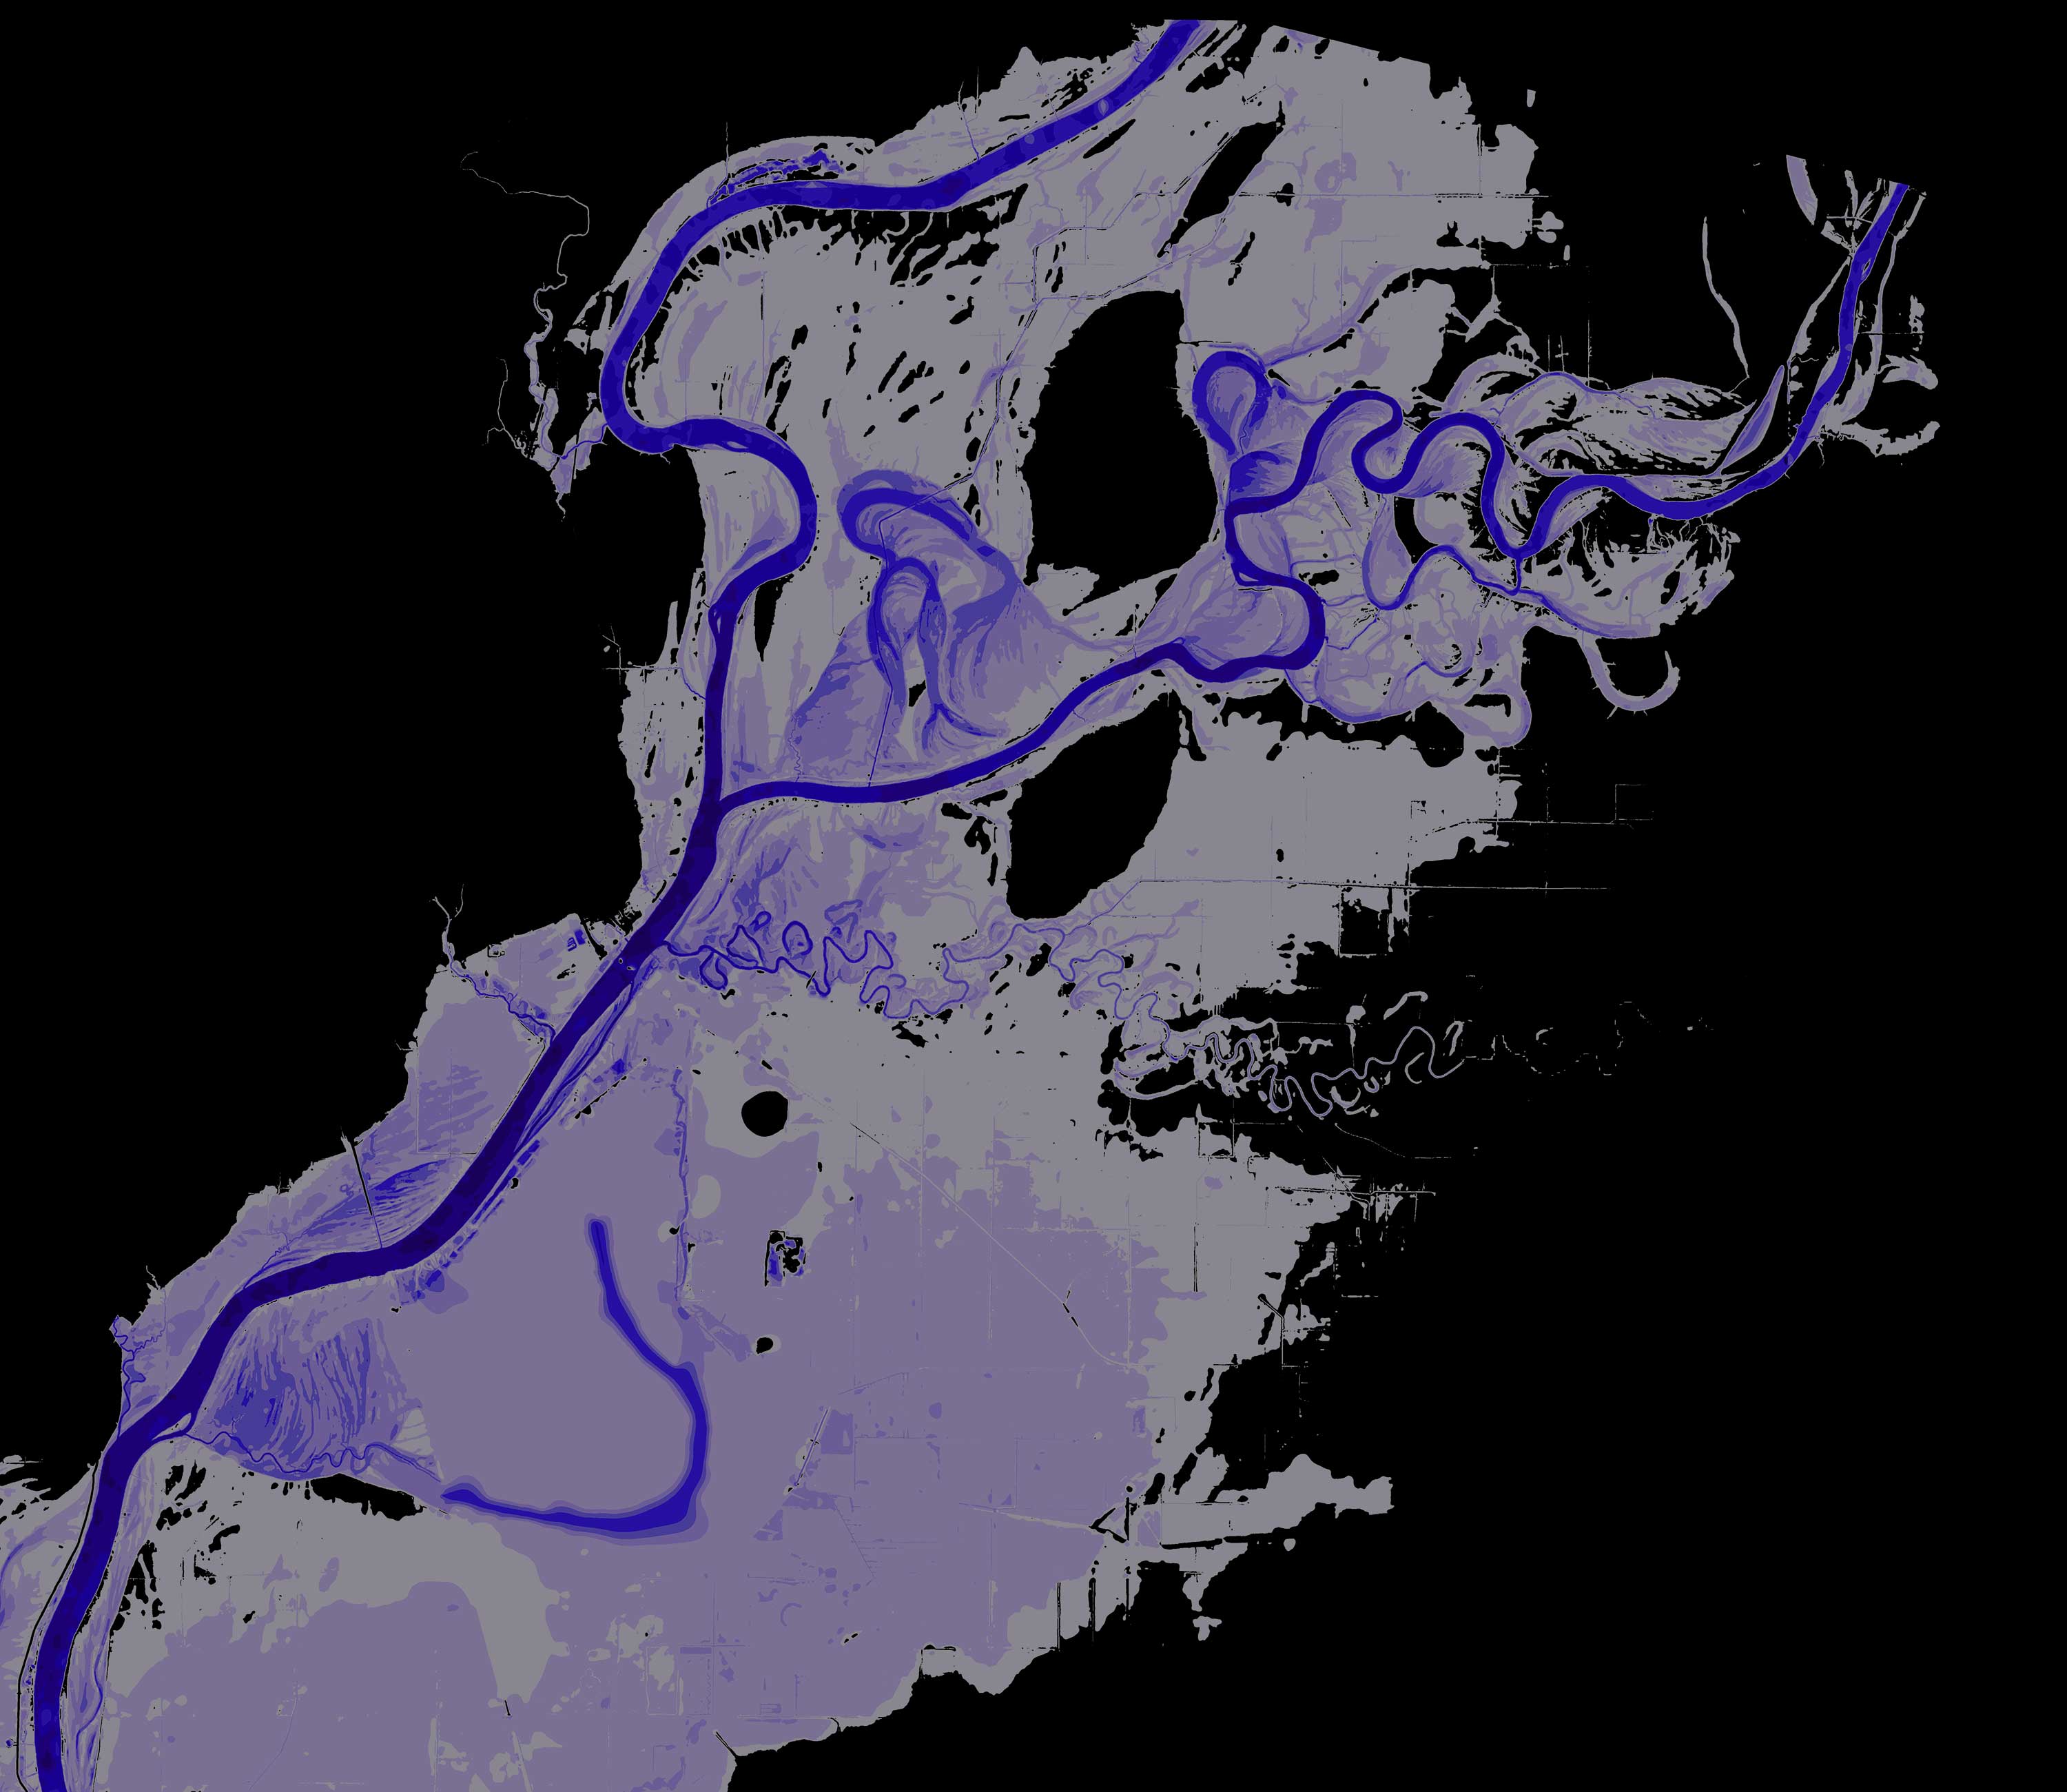
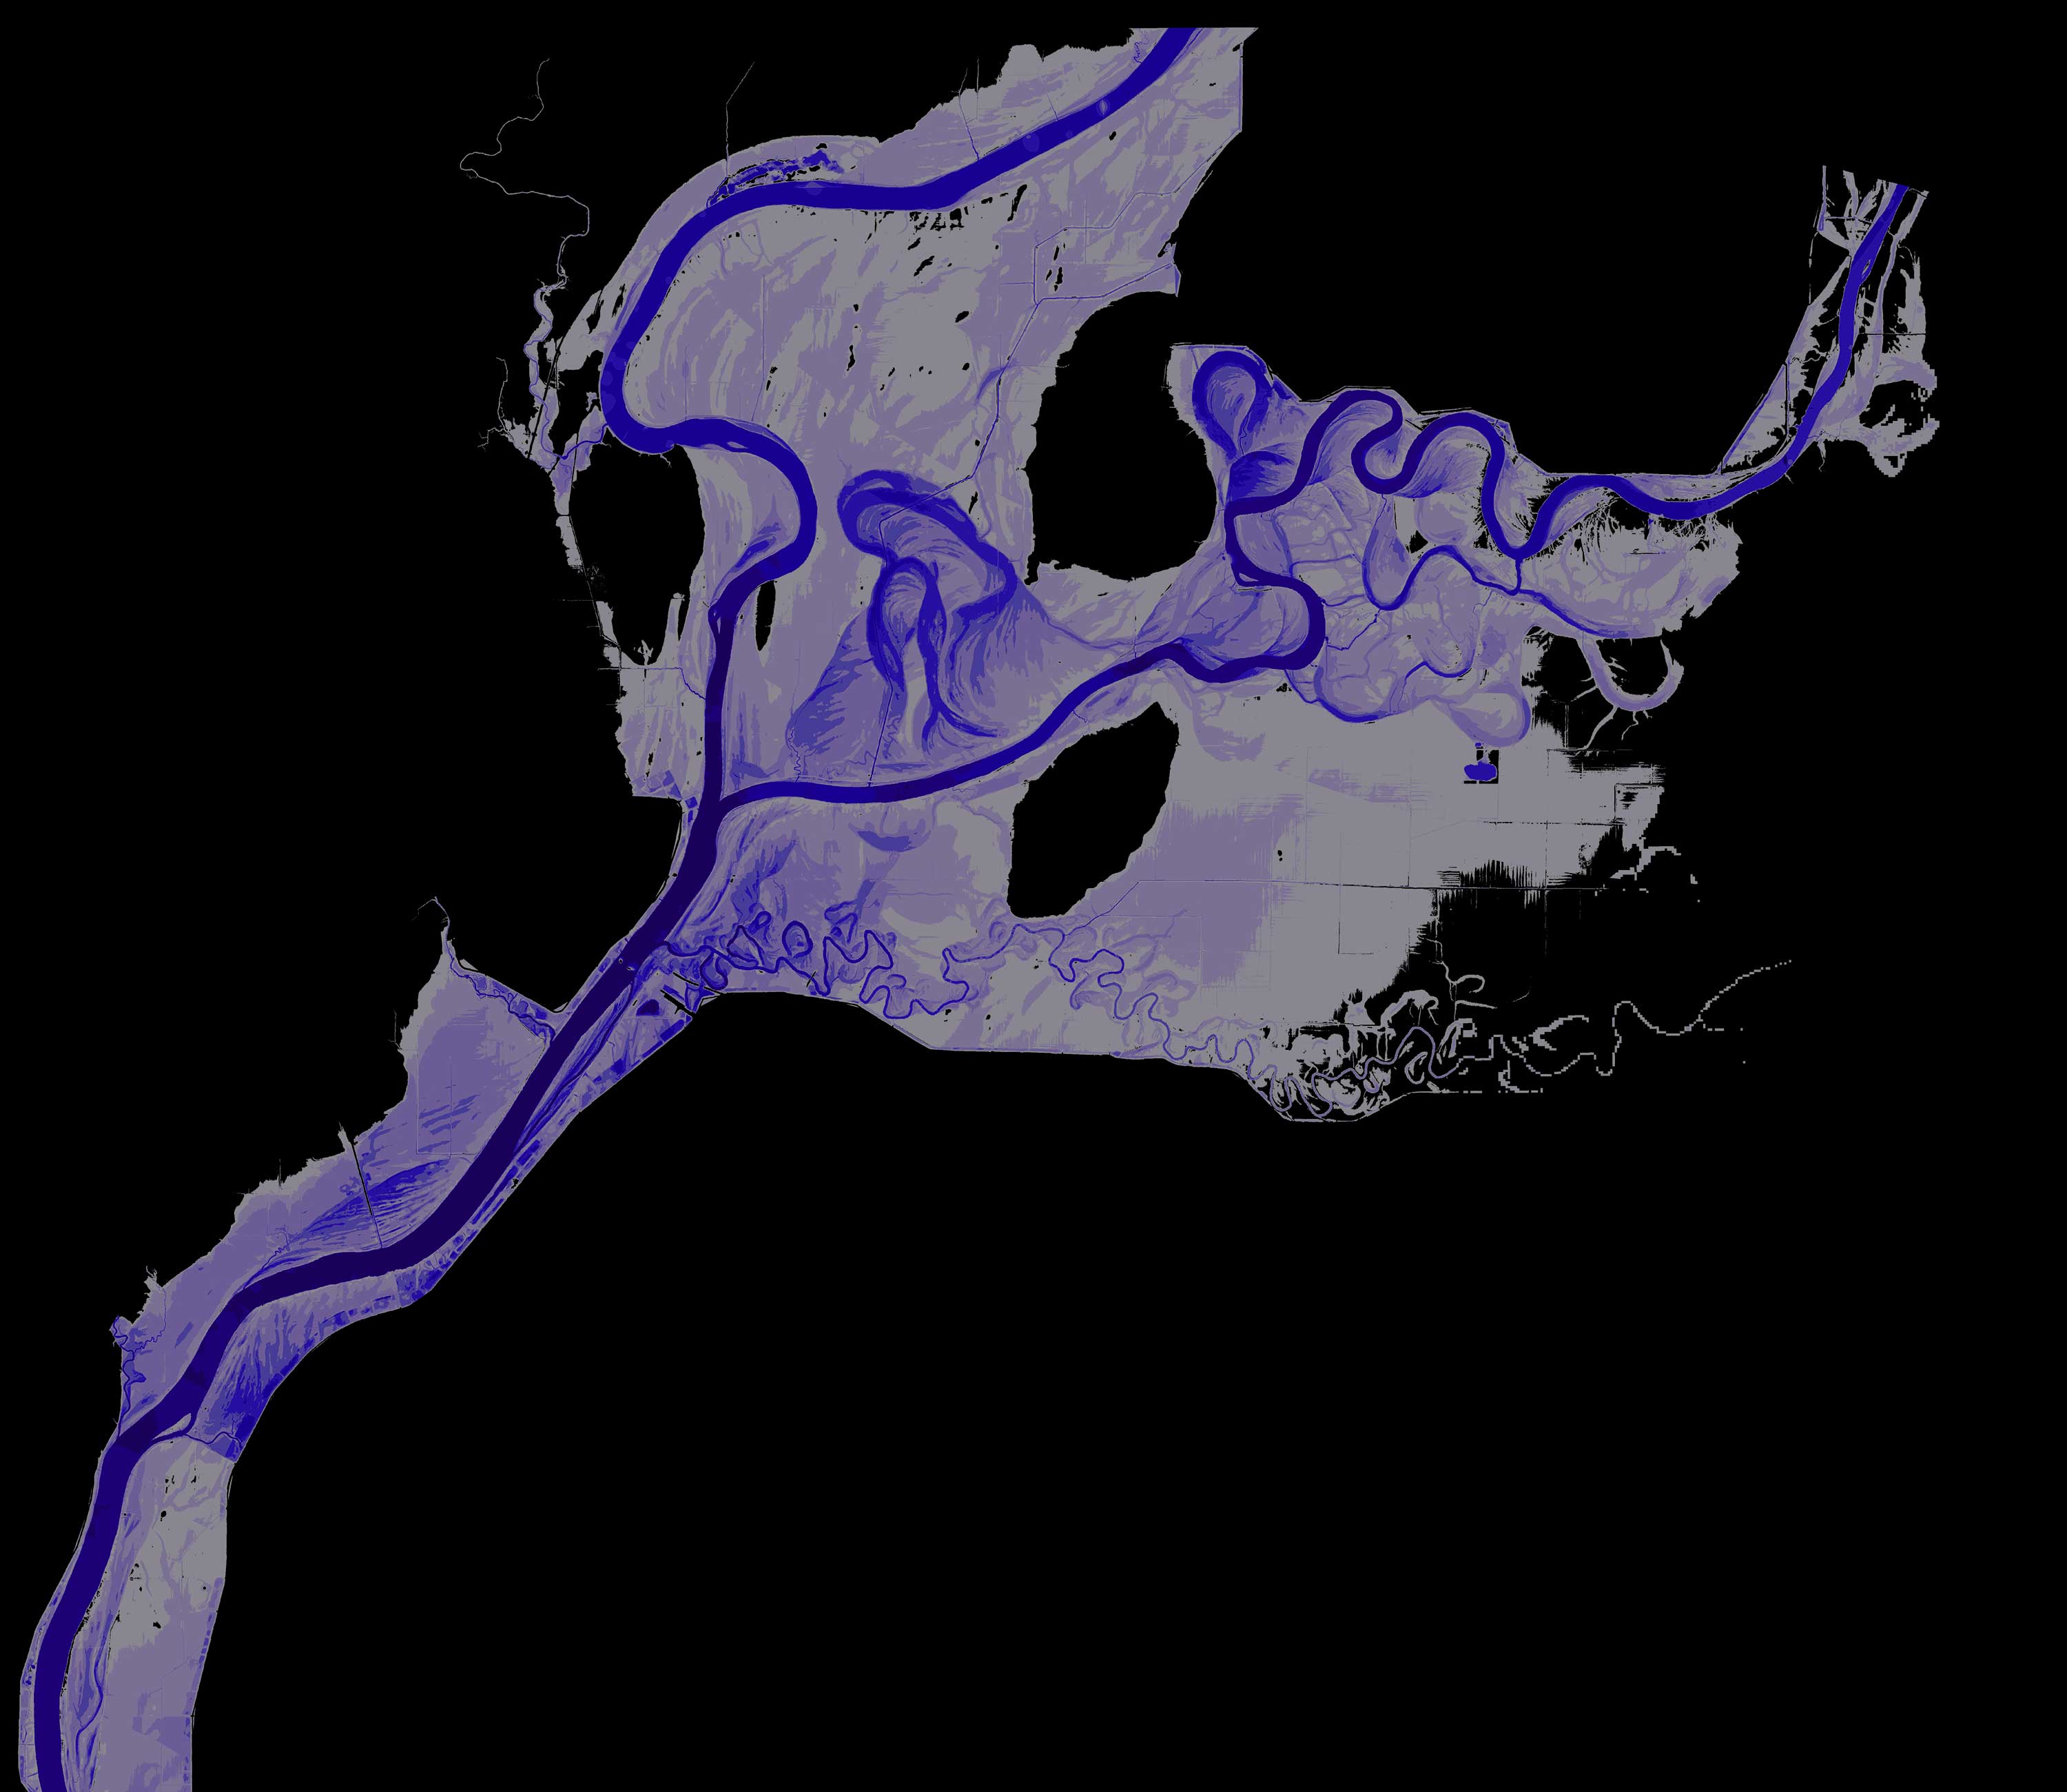
We asked Heine to map out roughly what that 10 percent chance flood would look like near Mt. Carmel before and after the levee:
Case Study
Wabash River at Mt. Carmel, Ill.
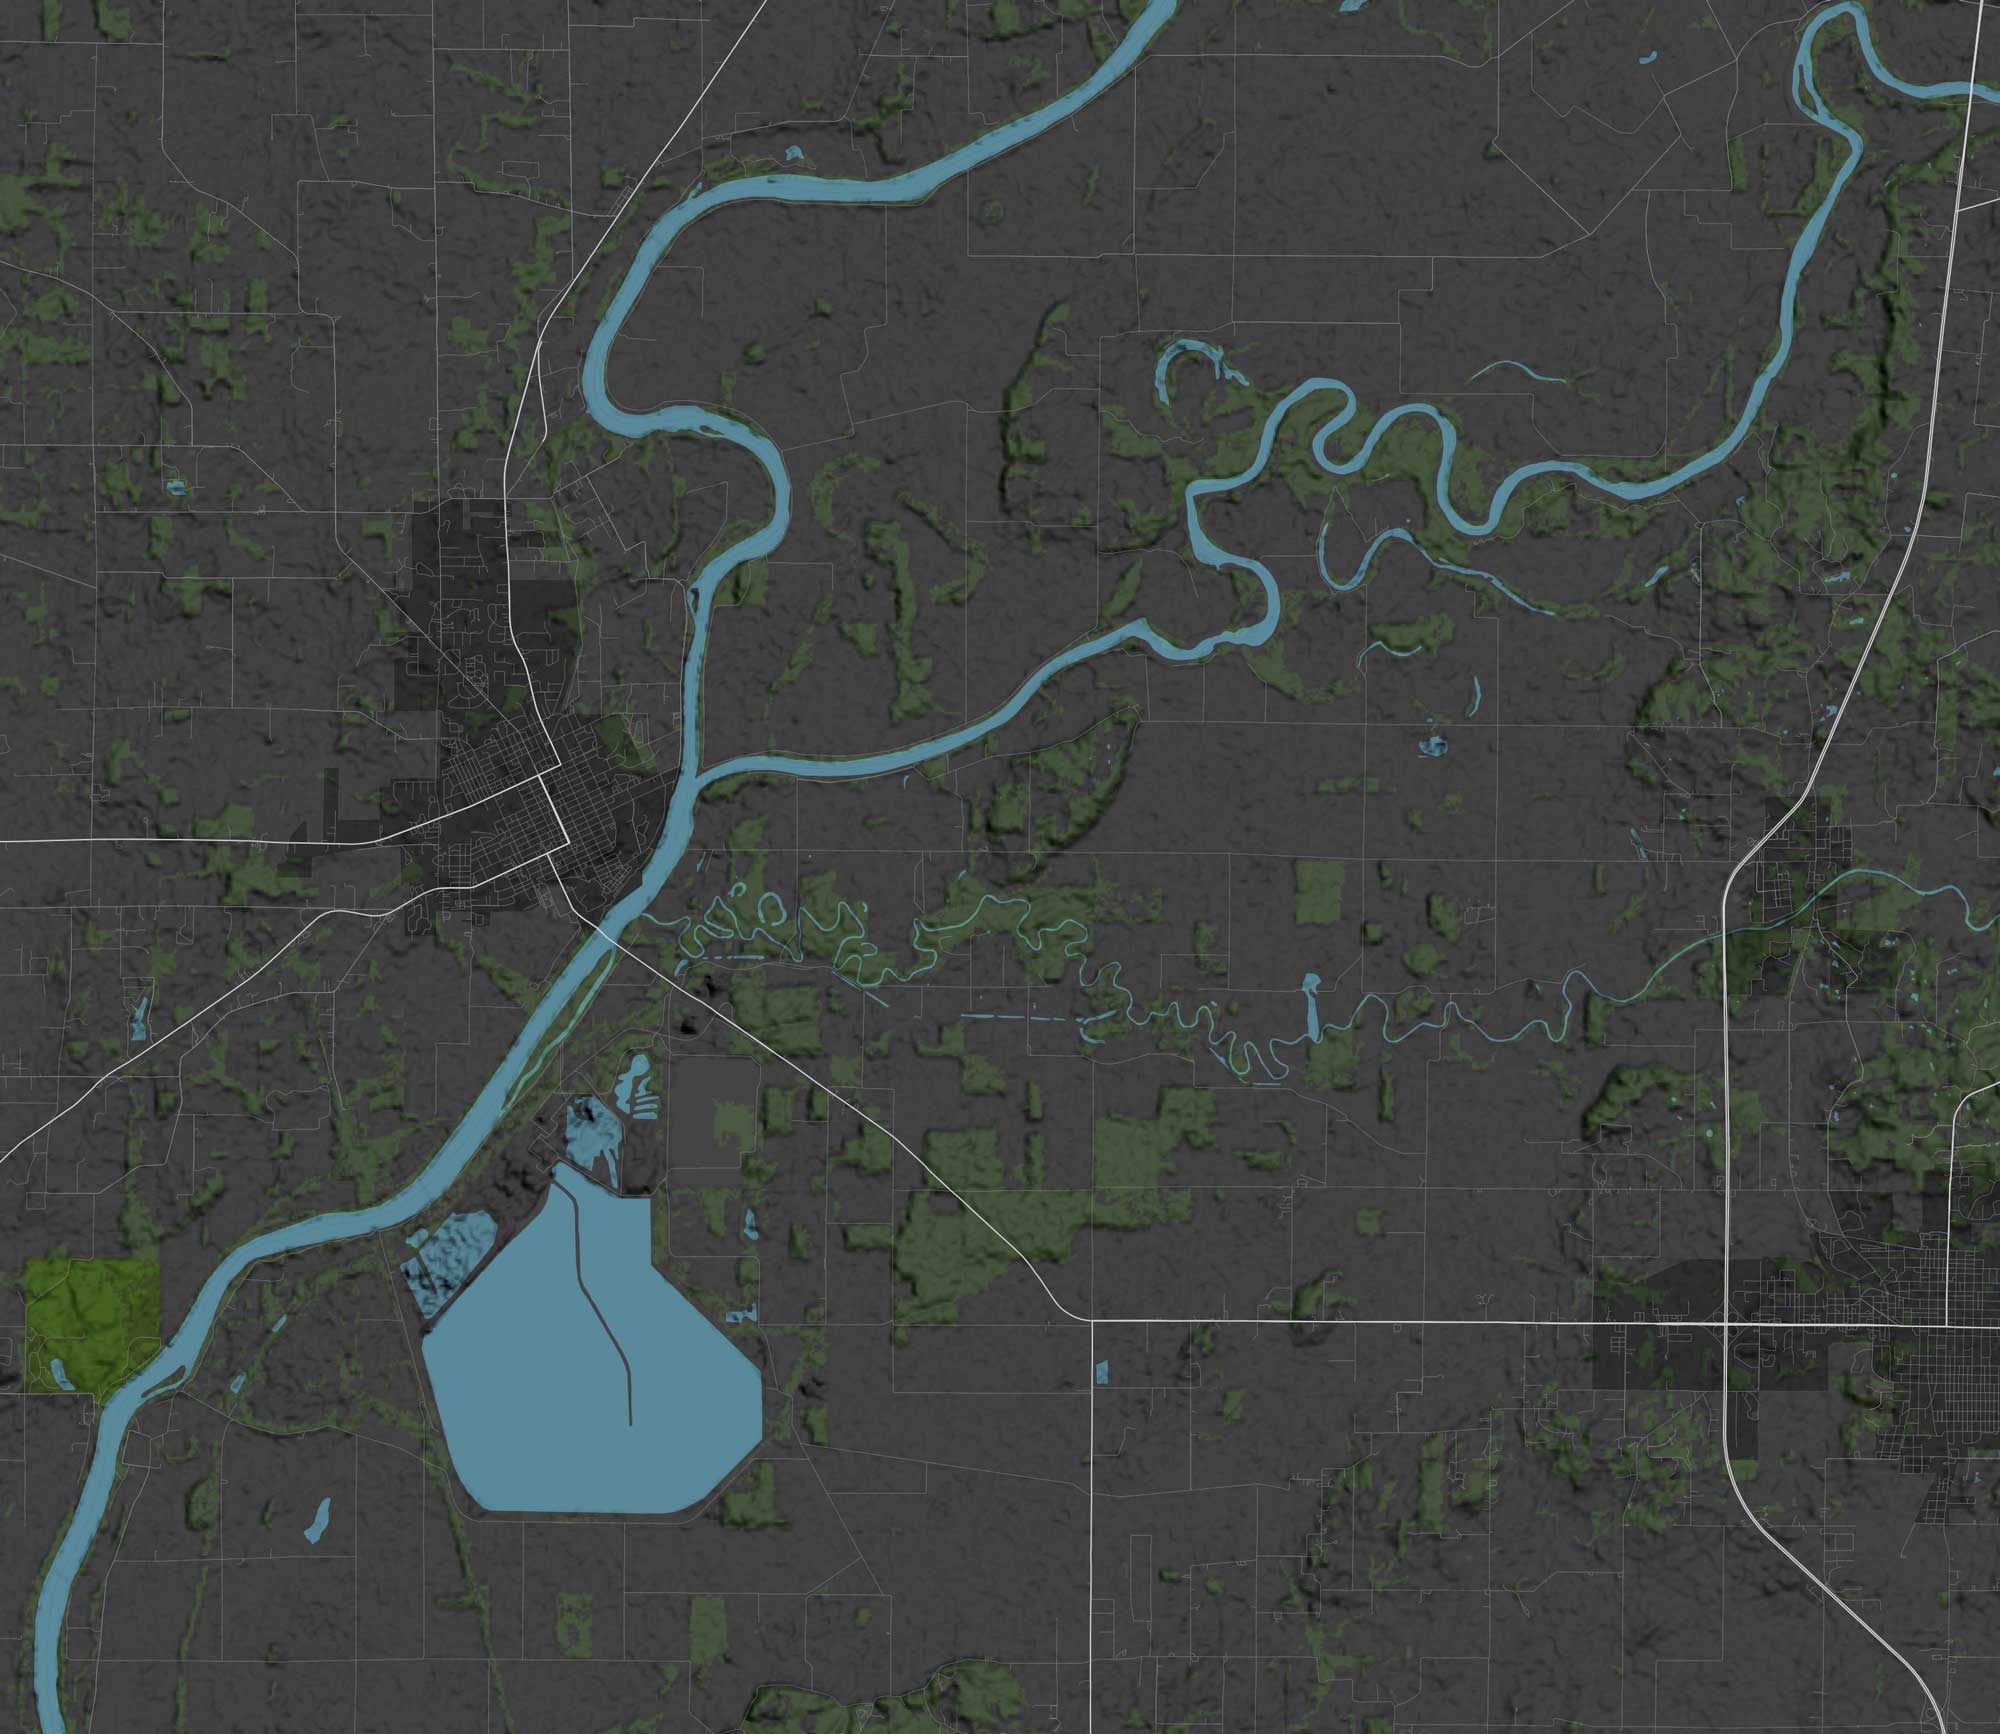
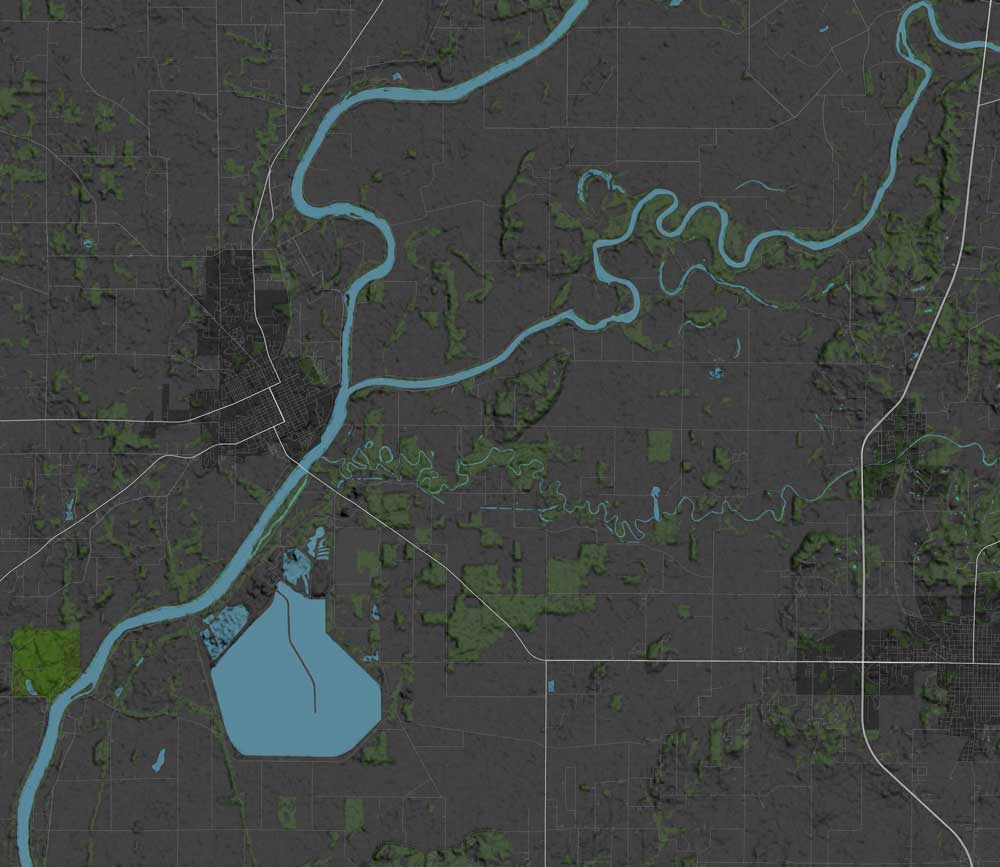
Mt. Carmel is a town in southern Illinois on the Wabash River, where it meets the White River in Indiana. It serves as a good case study for how levees work because it has a long record of continuous USGS stream gauge data, and not much else has been built in the floodplain besides a pair of levees, making it easier to isolate the effects levees have on flood levels.
Here's what a flood with a 10 percent chance of happening each year would have looked like before the Army Corps built levees in the mid-1960s. Water would have spread out into the area now occupied by the cooling pond for Duke Energy's power plant and other low-lying areas on both the Illinois and Indiana sides of the river.
After levees were built, they cut off most of the Wabash River's ability to reach the floodplain below the intersection with the White River, and water heights rose. In the same flood, water heights would be about three feet higher, and parts of Gibson and Knox counties would be flooded.
Source: Wabash River inundation GIS data provided to ProPublica by Reuben Heine, Augustana College.
Related story: Flood Thy Neighbor: Who stays dry and who decides?
River flume model designed, built and operated by Jeffrey Marr, Robert Gabrielson, Aaron Ketchmark and Erik Steen at the St. Anthony Falls Laboratory at the University of Minnesota. SAFL staff collected and processed high resolution topography and water surface elevation data from the model for ProPublica and Reveal.
Heine and Pinter’s original paper found the levee raised flood levels by more than seven feet, but a review of the Wabash River stream gauge’s history, prompted by ProPublica and Reveal, confirmed the maximum change is closer to five feet.
To create pre- and post-levee inundation layers on the Wabash River, Heine applied USGS stream gauge data to USGS high resolution lidar elevation data. To approximate pre-levee inundation data in the area now occupied by the Duke Energy power plant and cooling pond, he blended high resolution data with USGS 1950s 10 ft. contour lines to create a composite that that aimed to represent the pre-levee floodplain features.