This Is Where Hate Crimes Don’t Get Reported

Population

Source: Federal Bureau of Investigation Hate Crime Statistics, 2016
Every dot on this map, like this one, marks a gap in the FBI’s hate crimes data.
Jacksonville, the state's largest city, hasn't reported a hate crime since 2014.
Houston, America’s fourth largest city, only reported eight hate crimes, and Harris County reported zero.
Chicago did report hate crimes, but many large police and sheriff's agencies around it reported none.
Hawaii does not report hate crimes to the FBI at all.

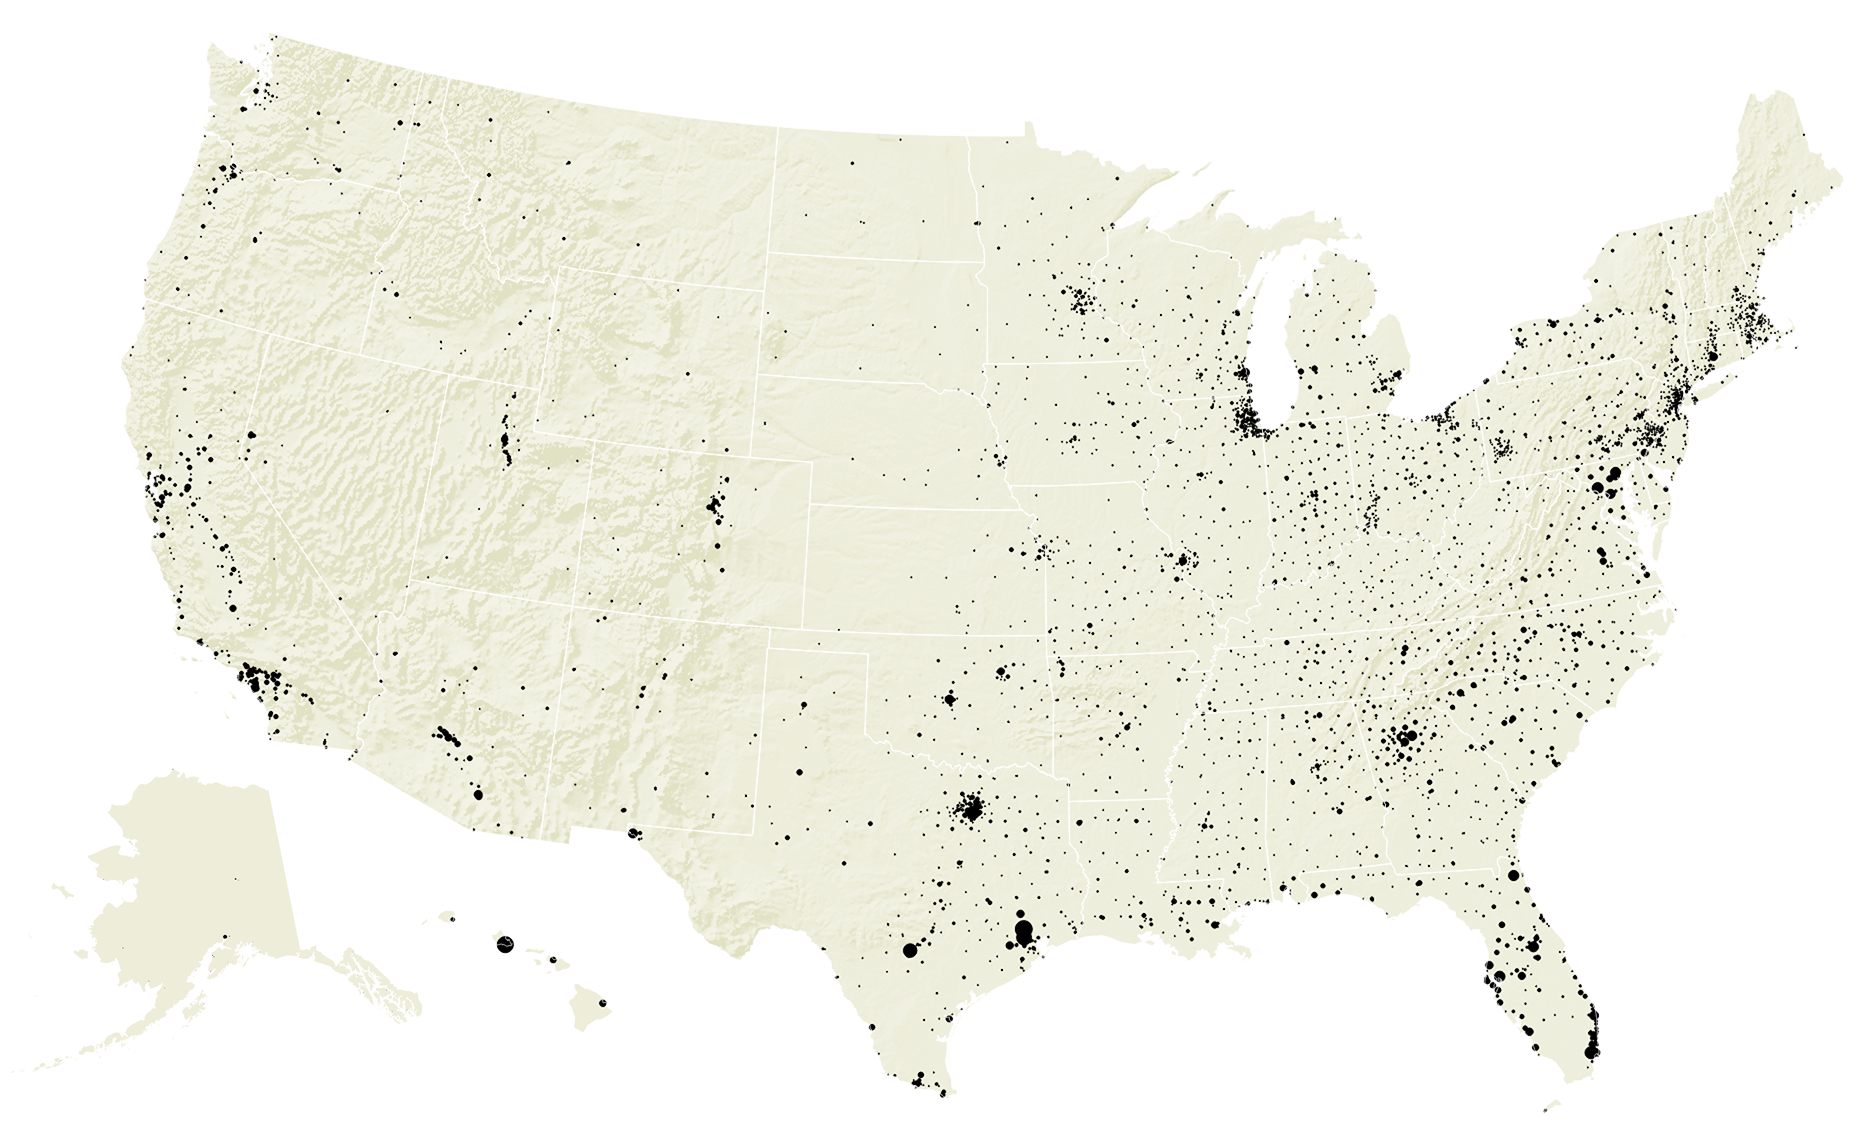
On Monday, the FBI released its latest tally of hate crimes in the U.S. Despite a 1990 law that mandates data collection on hate crimes, the FBI’s count remains only a fraction of what an annual national crime victims survey estimates the real number to be.

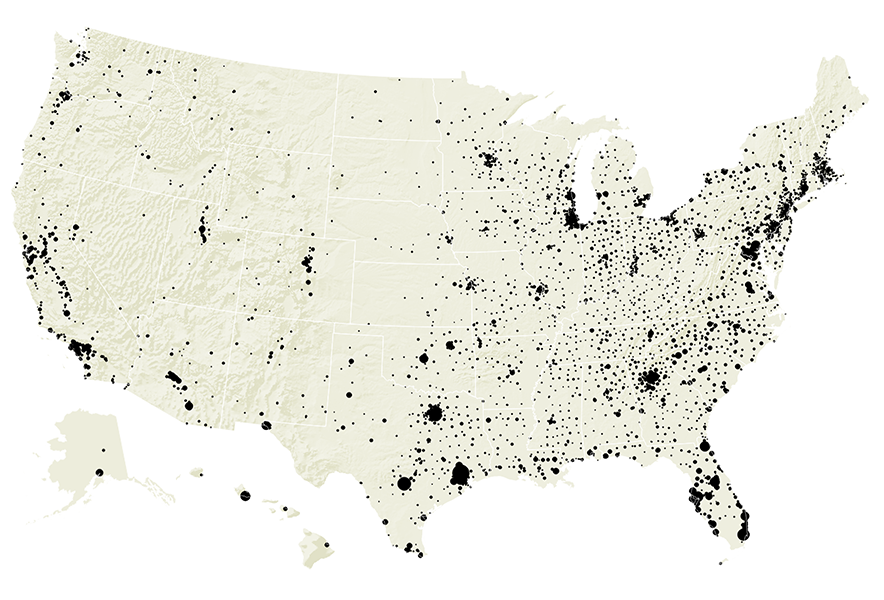
The above map shows some of the gaps that remain in the data. It marks every law enforcement agency serving at least 10,000 residents that failed to report at all in 2016, that reported zero hate crimes, or that reported fewer than one hate crime per 100,000 residents.

ProPublica’s reporting has shown that local jurisdictions often fail to properly recognize, investigate or prosecute hate crimes, and thus do not report them to the FBI.

So what else do we know about what we don’t know?

Location Matters: Compliance in States Varies Widely

The number of hate crimes reported in some states is far fewer than would be be expected given the size of their populations.

Take Florida, for example. It is the third most populous state but it reported fewer hate crimes than North Carolina, a state with half as many people. The 15 Florida law enforcement agencies with the most populous jurisdictions -- which together cover 40 percent of the state’s residents -- reported just 19 hate crimes in 2016 combined. By comparison, the Charlotte-Mecklenburg Police Department in North Carolina, which serves a community one-tenth as large, reported 27.

Below, each state is ranked by its size, represented by the bar in light blue, with the number of hate crimes overlaid in dark blue.

Hate Crimes Reported by State, 2016

stateChart1931178965951116144239148399282122387213391142788837341041192314262061043310617667124149263141270284012201518811115253WyomingVermontD.C.AlaskaNorth DakotaSouth DakotaDelawareMontanaRhode IslandMaineNew HampshireHawaiiIdahoWest VirginiaNebraskaNew MexicoKansasNevadaArkansasMississippiUtahIowaConnecticutOklahomaOregonKentuckyLouisianaAlabamaSouth CarolinaMinnesotaColoradoWisconsinMarylandMissouriIndianaTennesseeMassachusettsArizonaWashingtonVirginiaNew JerseyMichiganNorth CarolinaGeorgiaOhioPennsylvaniaIllinoisNew YorkFloridaTexasCaliforniaPopulation: 39 millionreportedhate crimes
Source: Federal Bureau of Investigation Hate Crime Statistics, 2016

Larger Agencies Are More Likely to Report at Least One Hate Crime

There is one factor that seems to predict whether a jurisdiction will report at least one hate crime. Agencies that serve larger communities are more likely to do so than agencies that serve smaller ones.

That isn’t necessarily so for all large communities -- Harris County, Texas, and Prince George’s County, Maryland both reported zero hate crimes in 2016. But large places do make up the bulk of hate crimes reported to the FBI.

To some extent, this is intuitive: Larger cities have more crime in general and they have bigger law enforcement agencies, some of which can have dedicated hate crimes specialists. Smaller places are much less likely to report even one incident, and more likely to not send in paperwork to the FBI at all.

Agencies’ reporting pattern, by agency size, 2007-2016

legendDid not reportReported zeroReported 1 or more
sizeChart2-RW200720160%100%1–2,499 people served2,500–9,99910,000–24,99925,000–49,99950,000–99,999100,000–249,999250,000+200720162007201620072016200720162007201620072016
Source: Federal Bureau of Investigation Hate Crime Statistics, 2016
sizeChart3250,000+people served100,000-249-99950,000-99,99925,000-49,99910,000-24,9992,500-9,9991-2,4990%100%
Source: Federal Bureau of Investigation Hate Crime Statistics, 2016

Here Are the 100 Largest Law Enforcement Agencies That Reported Zero or Very Few Hate Crimes in 2016 — or Didn’t Report at All

These law enforcement agencies serve some of America’s largest jurisdictions, but failed to submit hate crimes paperwork to the FBI, reported that they had no hate crimes at all, or reported fewer than one hate crime per 100,000 residents they police.

Agency State Population Served Reported
Hate Crimes
Hate Crimes
Per 100,000 People
Houston Police Department TX 2,334,348 8 0.34
Harris County Sheriff's Office TX 1,825,580 0 0
San Antonio Police Department TX 1,498,642 9 0.6
Dallas Police Department TX 1,320,939 11 0.83
Miami-Dade Police Department FL 1,206,757 1 0.08
Montgomery County Police Department MD 1,027,318 7 0.68
Honolulu (City And County) Police Department HI 995,572 Did not report 0
Hillsborough County Sheriff's Office FL 936,298 1 0.11
Jacksonville Sheriff's Office FL 880,557 Did not report 0
Orange County Sheriff's Office FL 839,791 3 0.36
Baltimore County Police Department MD 831,374 1 0.12
Gwinnett County Police Department GA 775,883 6 0.77
Prince George's County Police Department MD 695,413 0 0
El Paso Police Department TX 687,193 1 0.15
Palm Beach County Sheriff's Office FL 644,138 1 0.16
Oklahoma City Police Department OK 641,681 3 0.47
Baltimore Police Department MD 618,385 3 0.49
Milwaukee Police Department WI 600,193 2 0.33
Tucson Police Department AZ 533,663 5 0.94
Dekalb County Police Department GA 522,589 Did not report 0
Pasco County Sheriff's Office FL 464,968 1 0.22
Lee County Sheriff's Office FL 457,344 2 0.44
Montgomery County Sheriff's Office TX 453,685 0 0
Fort Bend County Sheriff's Office TX 451,651 0 0
Miami Police Department FL 449,469 Did not report 0
Polk County Sheriff's Office FL 432,574 Did not report 0
New Castle County Police Department DE 416,878 4 0.96
St. Louis County Police Dept MO 412,201 2 0.49
Tulsa Police Department OK 405,748 1 0.25
Maricopa County Sheriff's Office AZ 403,509 3 0.74
Tampa Police Department FL 375,904 3 0.8
Pima County Sheriff's Department AZ 365,857 1 0.27
Greenville County Sheriff's Office SC 355,269 1 0.28
Anaheim Police Department CA 353,504 1 0.28
Unified Police Department Of Greater Salt Lake UT 349,050 1 0.29
Chesterfield County Police Department VA 337,610 0 0
Jefferson Parish Sheriff's Office LA 332,528 0 0
Corpus Christi Police Department TX 327,948 0 0
Henrico County Division Of Police VA 326,958 1 0.31
Kern County Sheriff's Office CA 326,281 0 0
Collier County Sheriff's Office FL 325,526 Did not report 0
Howard County Police Department MD 316,777 1 0.32
Stockton Police Department CA 308,348 3 0.97
Manatee County Sheriff's Office FL 295,667 Did not report 0
Bexar County Sheriff's Office TX 288,255 1 0.35
Plano Police Department TX 288,242 1 0.35
Marion County Sheriff's Office FL 281,163 Did not report 0
Pinellas County Sheriff's Office FL 277,988 2 0.72
Knox County Sheriff's Office TN 268,450 1 0.37
Irvine Police Department CA 266,663 2 0.75
Sarasota County Sheriff's Office FL 265,310 Did not report 0
Hidalgo County Sheriff's Office TX 261,389 0 0
Escambia County Sheriff's Office FL 260,837 2 0.77
St. Petersburg Police Department FL 259,510 Did not report 0
Richland County Sheriff's Office SC 259,342 0 0
Laredo Police Department TX 259,325 0 0
Gilbert Police Department AZ 255,899 1 0.39
Lubbock Police Department TX 252,900 0 0
Kent County Sheriff's Office MI 251,219 2 0.8
Mobile Police Department AL 249,921 0 0
Norfolk Police Department VA 245,734 1 0.41
Reno Police Department NV 244,554 1 0.41
Winston-Salem Police Department NC 243,507 0 0
Glendale Police Department AZ 242,938 1 0.41
Savannah-Chatham Metropolitan Police Department GA 241,296 0 0
Irving Police Department TX 240,765 0 0
Horry County Police Department SC 239,885 2 0.83
Ottawa County Sheriff's Office MI 239,484 0 0
Hialeah Police Department FL 239,451 Did not report 0
Washington County Sheriff's Office OR 239,322 1 0.42
Garland Police Department TX 238,859 0 0
Monroe County Sheriff's Office NY 237,407 2 0.84
Fremont Police Department CA 235,881 1 0.42
Spartanburg County Sheriff's Office SC 230,725 0 0
Clark County Sheriff's Office WA 225,524 1 0.44
Clayton County Police Department GA 224,530 Did not report 0
Richmond Police Department VA 222,430 1 0.45
Seminole County Sheriff's Office FL 220,291 1 0.45
Osceola County Sheriff's Office FL 218,248 1 0.46
Forsyth County Sheriff's Office GA 214,395 Did not report 0
Lexington County Sheriff's Office SC 213,909 0 0
St. Johns County Sheriff's Office FL 213,590 1 0.47
Clackamas County Sheriff's Office OR 210,987 0 0
Rochester Police Department NY 209,643 2 0.95
Fontana Police Department CA 209,531 0 0
Douglas County Sheriff's Office CO 207,938 2 0.96
Moreno Valley Police Dept CA 206,224 0 0
Pinal County Sheriff's Office AZ 206,209 Did not report 0
Glendale Police Department CA 202,903 2 0.99
Columbus Police Department GA 202,338 Did not report 0
Amarillo Police Department TX 200,141 0 0
Montgomery Police Department AL 199,565 Did not report 0
Little Rock Police Department AR 198,800 1 0.5
St. Tammany Parish Sheriff's Office LA 198,389 0 0
Jefferson County Sheriff's Office CO 197,468 0 0
Richmond County Sheriff's Office GA 197,164 Did not report 0
Shreveport Police Department LA 196,467 0 0
Hawaii (County) Police Department HI 196,392 Did not report 0
Wake County Sheriff's Office NC 195,882 0 0
Salt Lake City Police Department UT 193,918 1 0.52
Source: Federal Bureau of Investigation Hate Crime Statistics, 2016

The lack of solid facts makes understanding the scope of hate incidents difficult. Since the presidential election last year, we’ve been collecting people’s stories of hate crimes and bias incidents. If you’ve been a victim of bias-motivated harassment or violence, or if you’ve witnessed something and want to tell your story, let us know.

Additional design and development by Al Shaw and Rob Weychert