Three decades after legislation pushed for the return of Native American remains to Indigenous communities, many of the nation’s top museums and universities still have the remains of thousands of people in their collections.
Does Your Local Museum or University Still Have Native American Remains?
Use this database to find out where Native American remains were taken from and which institutions report still having them. Check on institutions near you.
In 1990, Congress passed a law recognizing the unequal treatment of Native American remains and set up a process for tribes to request their return from museums and other institutions that had them. The law, known as the Native American Graves Protection and Repatriation Act or NAGPRA, sought to address this human rights issue by giving Indigenous peoples a way to reclaim their dead.
But more than 30 years after the law’s passage, about half of the remains of more than 210,000 Native Americans have yet to be returned. Tribes have struggled to reclaim them in part because of a lack of federal funding for repatriation and because institutions face little to no consequences for violating the law or dragging their feet.
This database allows you to search for information on the roughly 600 federally funded institutions that reported having such remains to the Department of the Interior. While the data is self-reported, it is a starting point for understanding the damage done by generations of Americans who stole, collected and displayed the remains and possessions of the continent’s Indigenous peoples — and the work done by tribes and institutions to repatriate those Native ancestors since.
650 institutions reported having Native Americans remains
90,831 / 42% of those remains have not been made available to tribes
613 tribes to which institutions made remains available
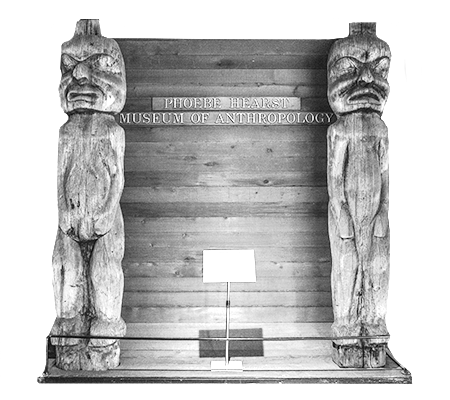
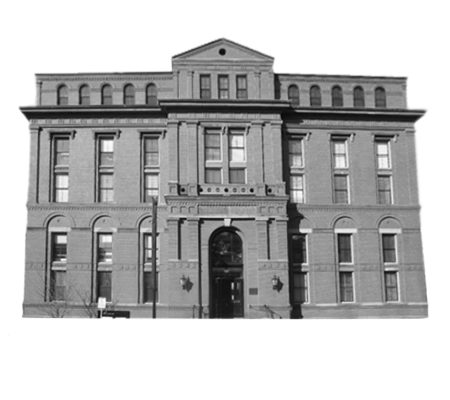
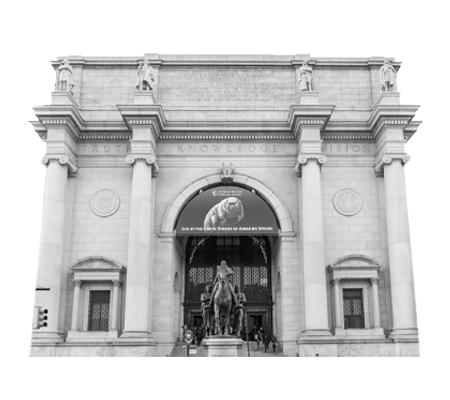
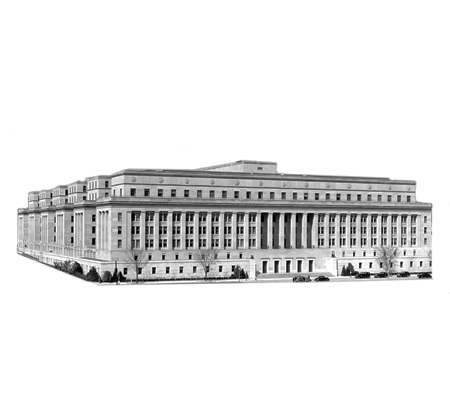
Ten institutions hold about half of the reported Native Americans remains that have not been made available for return to tribes. The list includes some of the country’s most prestigious universities, as well as federal agencies whose development projects disturbed Native American burials, and state museums whose archeology and anthropology programs originated with the excavation of key Native American sites and mounds. (At publication, the University of California, Berkeley was #1 on the list, the Tennessee Valley Authority was #8 on the list and the University of Arizona was #11. Updates to the data have changed these rankings since. The text refers to the original 10 institutions unless otherwise noted. See the rankings at publication here.)
Most of these institutions spent years after the law’s passage prioritizing scientific interest in the skeletal remains and objects above the human rights of tribes. Institutions also maintained an unwillingness or inability to bear the costs of taking inventory and fully consulting with tribes. [Read more about why these institutions still have the remains of thousands of Native Americans.]
Ten institutions hold about half of the reported Native American remains that have not been made available for return to tribes.
All of these institutions have used a loophole in the law that allows them to keep Native Americans remains if they deem them as “culturally unidentifiable,” meaning they can’t be culturally affiliated to a modern-day federally recognized tribe. Tribal representatives have long criticized NAGPRA for giving institutions the final say in these decisions.
In recent years, most of these institutions have expressed a greater willingness to engage with tribes, and several have brought on new staff to meet these goals. One of the main challenges many so-called repatriation coordinators face is figuring out exactly what is in their museums’ possession.
This accounting issue persists at the national level. The amount of unrepatriated Native American remains reported by institutions is a minimum estimate of individuals and institutions frequently adjust these numbers when they reinventory groups of remains. Some institutions that are subject to NAGPRA have also entirely failed to report the remains in their possession.
As a result, the numbers provided are best taken as estimates. The actual number and geographic scope of what’s held by publicly funded institutions is larger than what is presently documented.
Where Native American remains reported by institutions were taken from

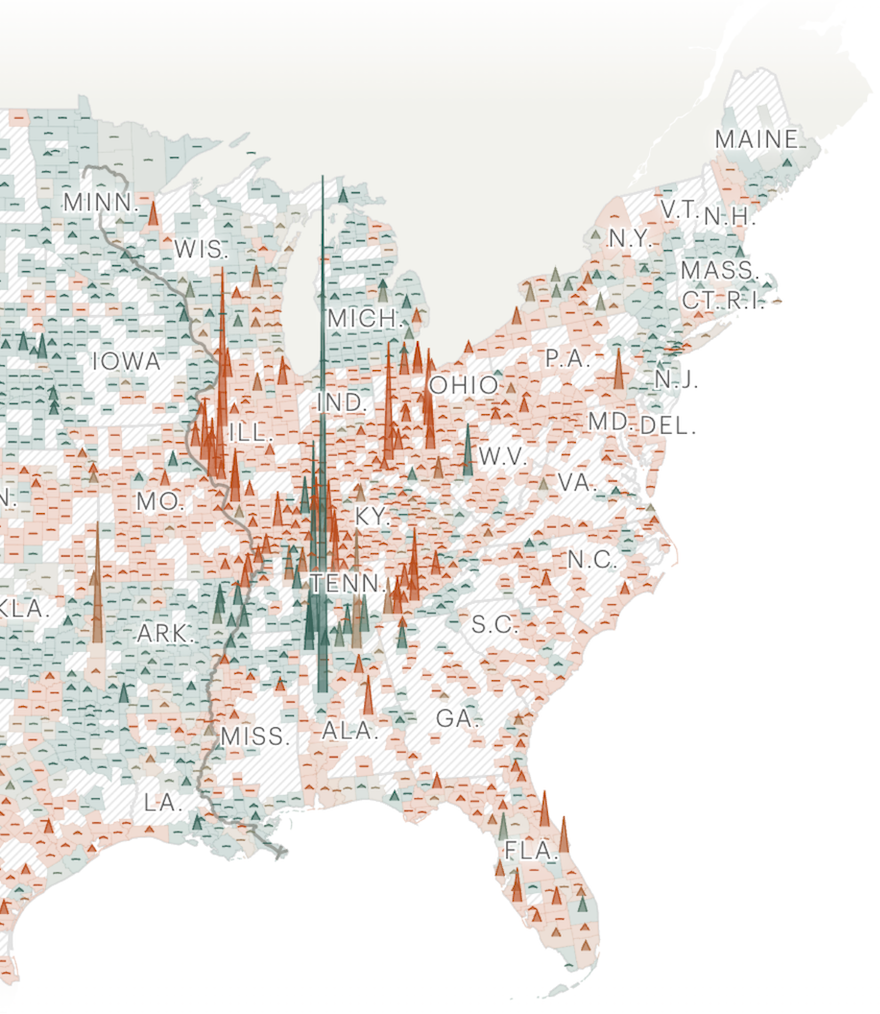
Institutions reported still having large numbers of human remains taken from east of the Mississippi River, in areas where most Indigenous peoples were forcibly removed in the 19th century.
Tribes say that more remains have been taken than are reported from places like Georgia.
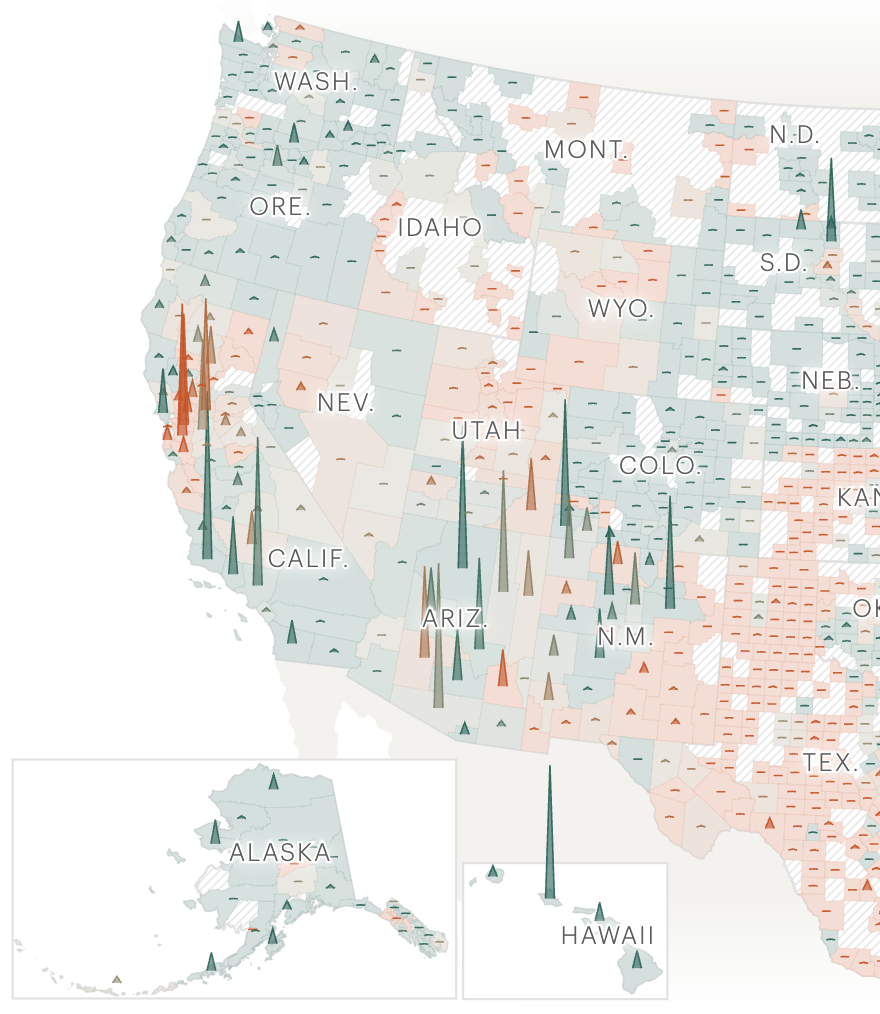
In California, where the Native population was decimated by settlers, thousands of human remains are still held by the state’s flagship universities.
More than 30 years after passage of the law, institutions continue to find previously undisclosed ancestral remains.
For example, in August 2022, the University of North Dakota announced it had found more than 250 boxes of Native American remains and belongings that had not been previously reported to federal officials. No penalties have been assessed against the institution, which has two years from the time of the discovery to complete an inventory.
“The University is now beginning the process of identifying those ancestors, which will allow them to be returned to their tribes,” said a university spokesperson. “UND remains committed to seeing the repatriation process carried through to completion.”
In 2022, the University of California, Berkeley, which has the largest amount of Native American remains in the country, completed a review of its holdings after facing questions over whether they had accurately cataloged the unrepatriated remains of more than 9,000 Native Americans that they reported to federal officials. A school spokesperson said that what it has reported now represents a “close estimate” of the Native American remains that it holds.
In October 2022, the Interior Department, which is led by the first Native American to serve in a cabinet post, proposed changes to NAGPRA regulations intended to expedite the return of ancestral remains and funerary belongings to tribes within three years. Some who work on repatriation for institutions and tribes have raised concerns about the feasibility of this timeline. Without the proposed regulations, the department projected that repatriating the rest of the Native American remains would take another 25 years roughly to complete at the current pace.
Institutions that reported having Native American remains
| Institution | Remains Not Made Available for Return | Remains Made Available for Return | % of Remains Made Available for Return |
|---|---|---|---|
| Ohio History Connection | 7,936 | 175 | 2% |
| Illinois State Museum | 5,801 | 1,522 | 21% |
| Harvard Univ. | 5,431 | 5,248 | 49% |
| Univ. of California, Berkeley | 4,794 | 7,189 | 60% |
| Indiana Univ. | 4,503 | 1,640 | 27% |
| Univ. of Kentucky | 3,787 | 978 | 21% |
| Univ. of Tennessee, Knoxville | 3,126 | 2,616 | 46% |
| Univ. of Alabama | 2,732 | 10,746 | 80% |
| Univ. of Arizona | 2,691 | 1,969 | 42% |
| Univ. of Florida | 2,620 | 377 | 13% |
| Univ. of Missouri, Columbia | 2,386 | 643 | 21% |
| Dept. of Defense | 2,001 | 5,375 | 73% |
| Center for American Archeology, Kampsville Archeological Center | 1,947 | 0 | 0% |
| Dept. of the Interior | 1,931 | 13,938 | 88% |
| Univ. of Texas at Austin | 1,898 | 341 | 15% |
| American Museum of Natural History | 1,773 | 1,773 | 50% |
| Milwaukee Public Museum | 1,557 | 116 | 7% |
| Univ. of Oklahoma | 1,477 | 2,395 | 62% |
| Florida Dept. of State | 1,448 | 79 | 5% |
| Field Museum | 1,288 | 594 | 32% |
| State Museum of Pennsylvania | 908 | 177 | 16% |
| Southern Illinois Univ., Carbondale | 846 | 0 | 0% |
| Arizona State Univ. | 786 | 35 | 4% |
| Museum of New Mexico, Museum of Indian Arts and Culture | 779 | 279 | 26% |
| Univ. of Michigan | 773 | 904 | 54% |
| Auburn Univ. | 762 | 7 | 1% |
| Univ. of Illinois, Urbana-Champaign | 761 | 190 | 20% |
| Dept. of Agriculture | 721 | 5,856 | 89% |
| Virginia Dept. of Historic Resources | 711 | 169 | 19% |
| Carnegie Museum of Natural History | 647 | 105 | 14% |
| Univ. of North Carolina at Chapel Hill | 645 | 440 | 41% |
| Univ. of New Mexico | 583 | 844 | 59% |
| Univ. of Georgia | 568 | 122 | 18% |
| Mississippi Dept. of Archives and History | 551 | 496 | 47% |
| New York State Museum | 515 | 638 | 55% |
| Florida State Univ. | 508 | 92 | 15% |
| Nassau County Dept. of Parks and Recreation | 482 | 29 | 6% |
| Cincinnati Museum Center | 456 | 73 | 14% |
| Yale Univ. | 448 | 420 | 48% |
| Dayton Museum of Natural History | 438 | 1 | 0% |
| Cleveland Museum of Natural History | 438 | 0 | 0% |
| Natural History Museum of Utah | 416 | 67 | 14% |
| Univ. of Pennsylvania | 397 | 234 | 37% |
| West Virginia Department of Arts, Culture and History | 371 | 1,031 | 74% |
| West Texas A and M Univ. | 362 | 0 | 0% |
| San Francisco State Univ. | 357 | 255 | 42% |
| Univ. of Kansas | 357 | 115 | 24% |
| Western Kentucky Univ. | 351 | 2 | 1% |
| Tennessee Dept. of Environment and Conservation | 342 | 525 | 61% |
| Los Angeles County Natural History Museum | 337 | 202 | 37% |
| Kansas State Historical Society | 305 | 103 | 25% |
| Missouri Dept. of Natural Resources | 301 | 36 | 11% |
| California Dept. of Parks and Recreation | 278 | 947 | 77% |
| Sonoma State Univ. | 267 | 320 | 55% |
| Museum of Texas Tech Univ. | 263 | 123 | 32% |
| North Carolina Office of State Archaeology | 259 | 23 | 8% |
| Univ. of Louisville | 259 | 16 | 6% |
| Gilcrease Museum | 255 | 354 | 58% |
| Ball State Univ. | 240 | 29 | 11% |
| Univ. of Texas at San Antonio | 236 | 61 | 21% |
| Indiana State Univ. | 232 | 0 | 0% |
| Wisconsin Historical Society | 227 | 804 | 78% |
| Univ. of South Carolina, SCIAA | 205 | 63 | 24% |
| Mississippi State Univ. | 196 | 179 | 48% |
| Missouri Dept. of Transportation | 196 | 0 | 0% |
| Univ. of Alaska Museum of the North | 191 | 33 | 15% |
| Maryland Historical Trust | 190 | 0 | 0% |
| Univ. of Toledo | 187 | 241 | 56% |
| Pennsylvania Western Univ., California | 183 | 0 | 0% |
| Univ. of California, Davis | 167 | 270 | 62% |
| Univ. of Cincinnati | 166 | 0 | 0% |
| East Carolina Univ. | 152 | 69 | 31% |
| Beloit College | 147 | 224 | 60% |
| Univ. of Arkansas | 143 | 3,270 | 96% |
| SUNY Univ. at Buffalo | 143 | 34 | 19% |
| Univ. of South Florida | 142 | 100 | 41% |
| Cal. State, Long Beach | 140 | 275 | 66% |
| Idaho State Historical Society, Archaeological Survey of Idaho | 136 | 1 | 1% |
| Univ. of Louisiana at Monroe | 135 | 0 | 0% |
| Graves Museum of Archaeology and Natural History | 131 | 0 | 0% |
| Georgia Dept. of Natural Resources | 130 | 407 | 76% |
| Univ. of Wisconsin, Oshkosh | 130 | 55 | 30% |
| Autry Museum of the American West | 123 | 76 | 38% |
| North Museum of Nature and Science | 120 | 0 | 0% |
| Rochester Museum and Science Center | 114 | 1,548 | 93% |
| Texas State Univ. | 114 | 7 | 6% |
| Hawaii Dept. of Land and Natural Resources | 114 | 0 | 0% |
| Cal. State, Chico | 112 | 547 | 83% |
| Temple Univ. | 112 | 9 | 7% |
| Los Angeles County | 103 | 0 | 0% |
| Utah Dept. of Natural Resources | 99 | 37 | 27% |
| Western Reserve Historical Society | 99 | 0 | 0% |
| Wake Forest Univ., Archeology Labs | 98 | 0 | 0% |
| Sarasota County History Center | 93 | 0 | 0% |
| Brown Univ. | 90 | 22 | 20% |
| Earlham College | 89 | 2 | 2% |
| California Dept. of Transportation | 88 | 836 | 90% |
| Minnesota Indian Affairs Council | 86 | 1,915 | 96% |
| Univ. of Memphis | 85 | 553 | 87% |
| Filoli Center | 85 | 0 | 0% |
| Univ. of Wyoming | 83 | 144 | 63% |
| New York Univ. | 82 | 163 | 67% |
| Brigham Young Univ. | 81 | 47 | 37% |
| Charleston Museum | 78 | 2 | 3% |
| Indiana State Museum and Historic Sites Corporation | 77 | 106 | 58% |
| San Diego State Univ. | 76 | 54 | 42% |
| Oshkosh Public Museum | 74 | 5 | 6% |
| Allen County Museum and Historical Society | 73 | 0 | 0% |
| Univ. of Rhode Island | 72 | 5 | 6% |
| Buffalo Museum of Science | 72 | 0 | 0% |
| Museum of Northern Arizona | 70 | 89 | 56% |
| Bowers Museum | 70 | 1 | 1% |
| Tioga Point Museum | 70 | 0 | 0% |
| Robert S. Peabody Institute of Archaeology | 67 | 2,222 | 97% |
| Cal. State, Easy Bay | 66 | 0 | 0% |
| Southern Utah Univ. Archeological Repository | 64 | 0 | 0% |
| Oregon State Univ. | 63 | 147 | 70% |
| South Dakota State Historical Society, State Archaeological Research Center | 63 | 143 | 69% |
| Lawrence Univ. | 62 | 0 | 0% |
| Trinidad State Junior College | 62 | 0 | 0% |
| Univ. of South Alabama | 60 | 9 | 13% |
| Southeast Missouri State Univ. | 59 | 0 | 0% |
| Neville Public Museum | 55 | 53 | 49% |
| Central Washington Univ. | 53 | 322 | 86% |
| Grand Rapids Public Museum | 53 | 185 | 78% |
| Museums of Western Colorado | 53 | 0 | 0% |
| Northwestern Univ. | 53 | 0 | 0% |
| Mutter Museum, College of Physicians of Philadelphia | 52 | 9 | 15% |
| Northern Kentucky Univ. | 52 | 0 | 0% |
| Univ. of Minnesota, Duluth | 51 | 0 | 0% |
| Dartmouth College | 49 | 18 | 27% |
| Univ. of Wisconsin, La Crosse | 49 | 0 | 0% |
| Museum of Us | 47 | 500 | 91% |
| Univ. of Texas, El Paso | 47 | 0 | 0% |
| Nevada State Museum | 46 | 40 | 47% |
| Univ. of Indianapolis | 46 | 0 | 0% |
| New Mexico State Univ. Museum | 45 | 288 | 86% |
| Hastings Museum | 45 | 109 | 71% |
| Univ. of Miami | 45 | 0 | 0% |
| South Carolina Dept. of Parks, Recreation, and Tourism | 44 | 0 | 0% |
| New Mexico Highlands Univ. | 42 | 0 | 0% |
| Purdue Univ. | 42 | 0 | 0% |
| Portland State Univ. | 41 | 38 | 48% |
| Witte Museum | 40 | 32 | 44% |
| St. Joseph Museums, Inc. | 40 | 17 | 30% |
| Univ. of Colorado, Denver | 40 | 0 | 0% |
| Western Colorado Univ. | 40 | 0 | 0% |
| Carlsbad Museum | 39 | 6 | 13% |
| Case Western Reserve Univ. | 39 | 5 | 11% |
| Anniston Museum of Natural History | 39 | 2 | 5% |
| Brazos Valley Museum of Natural History | 39 | 0 | 0% |
| Museum of Osteopathic Medicine | 39 | 0 | 0% |
| Cal. State, Northridge | 38 | 0 | 0% |
| History Nebraska | 37 | 799 | 96% |
| Louisiana State Univ. | 36 | 1,211 | 97% |
| Univ. of Southern Mississippi | 36 | 56 | 61% |
| Stanford Univ. Heritage Services | 36 | 12 | 25% |
| San Bernardino County Museum | 35 | 50 | 59% |
| Memphis Pink Palace Museum | 35 | 18 | 34% |
| Cleveland State Univ. | 35 | 1 | 3% |
| Foothill-De Anza Community College District | 35 | 0 | 0% |
| Univ. of Oregon | 34 | 546 | 94% |
| Texas A and M Univ. | 33 | 112 | 77% |
| Wichita State Univ. | 33 | 0 | 0% |
| Eastern Arizona College Foundation | 32 | 0 | 0% |
| Univ. of the Incarnate Word | 32 | 0 | 0% |
| Springfield Science Museum | 31 | 107 | 78% |
| Sul Ross State Univ. | 31 | 0 | 0% |
| Michigan State Historic Preservation Office | 30 | 27 | 47% |
| Univ. of Nebraska State Museum | 29 | 1,992 | 99% |
| Univ. of Iowa | 29 | 1,419 | 98% |
| Oakland Museum of California | 28 | 2 | 7% |
| The History Museum | 28 | 0 | 0% |
| Heidelberg Univ. | 27 | 0 | 0% |
| Cranbrook Institute of Science | 26 | 39 | 60% |
| Houston Museum of Natural Science | 26 | 0 | 0% |
| Wagner Free Institute of Science | 26 | 0 | 0% |
| Western Illinois Univ. | 26 | 0 | 0% |
| Univ. of Montana | 25 | 46 | 65% |
| Univ. of California, Santa Barbara | 24 | 417 | 95% |
| Santa Cruz Museum of Natural History | 24 | 0 | 0% |
| Georgia Southern Univ. | 23 | 0 | 0% |
| Augusta Museum of History | 22 | 0 | 0% |
| Idaho State Univ. | 22 | 0 | 0% |
| State of Alaska Medical Examiner Office | 22 | 0 | 0% |
| Univ. of Missouri, St. Louis | 21 | 0 | 0% |
| Wayne State Univ. | 20 | 92 | 82% |
| Louisiana Dept. of Culture, Recreation, and Tourism | 20 | 11 | 35% |
| Missouri State Univ. | 20 | 0 | 0% |
| No Man's Land Historical Society | 20 | 0 | 0% |
| Tennessee Valley Authority | 19 | 14,134 | 100% |
| East Bay Municipal Utility District | 19 | 31 | 62% |
| Cal. State, Bakersfield | 19 | 14 | 42% |
| Dept. of Energy | 19 | 7 | 27% |
| Kansas City Museum | 18 | 2 | 10% |
| Western Washington Univ. | 17 | 62 | 78% |
| Texas Parks and Wildlife | 17 | 17 | 50% |
| Poverty Point World Heritage Site | 17 | 0 | 0% |
| Louisiana State Exhibit Museum | 16 | 0 | 0% |
| Montana Historical Society | 16 | 0 | 0% |
| Tippecanoe County Historical Association | 16 | 0 | 0% |
| Missouri Historical Society | 15 | 2 | 12% |
| Auburn Univ. at Montgomery | 15 | 0 | 0% |
| Buffalo State College | 15 | 0 | 0% |
| Henry County Historical Society | 15 | 0 | 0% |
| Oregon Historical Society | 14 | 1 | 7% |
| New Harmony Workingmen's Institute | 14 | 0 | 0% |
| Univ. of West Florida | 14 | 0 | 0% |
| Heard Museum | 13 | 35 | 73% |
| Oklahoma Historical Society | 12 | 0 | 0% |
| Spratt-Mead Museum | 12 | 0 | 0% |
| Peabody Essex Museum | 11 | 59 | 84% |
| Montana State Univ., Museum of the Rockies | 11 | 7 | 39% |
| Willamette Univ. | 11 | 5 | 31% |
| Univ. of Nevada, Reno | 11 | 2 | 15% |
| Montana State Univ., Bozeman | 11 | 0 | 0% |
| The Discovery Museum - Science and Space Center | 11 | 0 | 0% |
| Columbus Museum | 10 | 68 | 87% |
| Univ. of Central Missouri | 10 | 6 | 38% |
| San Diego Mesa College | 10 | 0 | 0% |
| Texas Historical Commission | 10 | 0 | 0% |
| Alaska Office of History and Archeology | 9 | 8 | 47% |
| Putnam Museum | 9 | 6 | 40% |
| Discovery Place | 9 | 1 | 10% |
| de Young Museum | 9 | 0 | 0% |
| Ohio Univ. | 9 | 0 | 0% |
| Phillip and Patricia Frost Museum of Science | 9 | 0 | 0% |
| U.S. Environmental Protection Agency | 9 | 0 | 0% |
| Washington Univ. | 9 | 0 | 0% |
| S'edav Va'aki Museum | 8 | 362 | 98% |
| Texas Dept. of Transportation | 8 | 138 | 95% |
| Univ. of Idaho | 8 | 36 | 82% |
| Cal. Polytechnic State Univ., San Luis Obispo | 8 | 0 | 0% |
| Coryell County Sheriff's Dept. | 8 | 0 | 0% |
| Goodhue County Historical Society | 8 | 0 | 0% |
| Speed Art Museum | 8 | 0 | 0% |
| Univ. of Wisconsin, Madison | 7 | 166 | 96% |
| Seton Hall Univ. | 7 | 26 | 79% |
| Kent State Univ. | 7 | 16 | 70% |
| Cal. State, Monterey Bay | 7 | 0 | 0% |
| City of Oxnard | 7 | 0 | 0% |
| Clark County Historical Museum | 7 | 0 | 0% |
| San Mateo County Community College District | 7 | 0 | 0% |
| Univ. of Akron | 7 | 0 | 0% |
| Univ. of Northern Iowa | 7 | 0 | 0% |
| Univ. of Texas Permian Basin | 7 | 0 | 0% |
| Warren County Historical Society | 7 | 0 | 0% |
| Washington State Parks and Recreation Commission | 6 | 24 | 80% |
| Cal. State, Fullerton | 6 | 18 | 75% |
| Filson Historical Society | 6 | 13 | 68% |
| Palmer Foundation for Chiropractic History | 6 | 4 | 40% |
| Univ. of Notre Dame | 6 | 2 | 25% |
| Cal. State, Dominguez Hills | 6 | 0 | 0% |
| Cal. State, Stanislaus | 6 | 0 | 0% |
| Fort Concho NHL | 6 | 0 | 0% |
| Grout Museum of History and Science | 6 | 0 | 0% |
| Kenosha Public Museum | 6 | 0 | 0% |
| Louisiana Dept. of Justice | 6 | 0 | 0% |
| Navajo County Coroner | 6 | 0 | 0% |
| New Jersey State Museum | 5 | 209 | 98% |
| Pennsylvania State Univ. | 5 | 51 | 91% |
| Mercyhurst Univ. | 5 | 12 | 71% |
| Maryland Center for History and Culture | 5 | 3 | 38% |
| Bridgewater College | 5 | 1 | 17% |
| College of Southern Idaho | 5 | 1 | 17% |
| St. Louis Science Center | 5 | 1 | 17% |
| Capital City Museum | 5 | 0 | 0% |
| Hardin County Historical Museums | 5 | 0 | 0% |
| Layland Museum | 5 | 0 | 0% |
| Richmond Museum of History | 5 | 0 | 0% |
| Rocky Ford Historical Museum | 5 | 0 | 0% |
| Triton Museum of Art | 5 | 0 | 0% |
| Fort Lewis College | 4 | 164 | 98% |
| Arizona Museum of Natural History | 4 | 101 | 96% |
| Museum of Natural History and Planetarium | 4 | 14 | 78% |
| Eastern California Museum | 4 | 3 | 43% |
| Buffalo Bill Center of the West | 4 | 2 | 33% |
| Brooklyn Museum | 4 | 1 | 20% |
| Cape Cod Museum of Natural History | 4 | 0 | 0% |
| Columbia College, Yosemite Community College District | 4 | 0 | 0% |
| Goshen College | 4 | 0 | 0% |
| Koshare Indian Museum | 4 | 0 | 0% |
| Southern Oregon Univ. | 4 | 0 | 0% |
| West Valley College | 4 | 0 | 0% |
| Univ. of Wisconsin, Milwaukee | 3 | 85 | 97% |
| Museum of Riverside | 3 | 39 | 93% |
| Utah State Univ. | 3 | 16 | 84% |
| Kingman Museum, Inc. | 3 | 7 | 70% |
| High Desert Museum | 3 | 4 | 57% |
| Madison County Historical Society | 3 | 1 | 25% |
| Aurora Historical Society | 3 | 0 | 0% |
| College of the Ozarks | 3 | 0 | 0% |
| Fort Worth Museum of Science and History | 3 | 0 | 0% |
| Lackawanna Historical Society | 3 | 0 | 0% |
| Louisiana Cultural Heritage Museum | 3 | 0 | 0% |
| Loxahatchee Historical Society | 3 | 0 | 0% |
| Salisbury House | 3 | 0 | 0% |
| Santa Clara Univ. | 3 | 0 | 0% |
| Univ. of Southern Indiana | 3 | 0 | 0% |
| Univ. of California, Los Angeles | 2 | 2,069 | 100% |
| Santa Barbara Museum of Natural History | 2 | 1,049 | 100% |
| Cal. State, Fresno | 2 | 160 | 99% |
| Central Michigan Univ. | 2 | 145 | 99% |
| Univ. of California, Riverside | 2 | 41 | 95% |
| Marshall Univ. | 2 | 38 | 95% |
| Broome County Historical Society | 2 | 11 | 85% |
| Klamath County Museum | 2 | 10 | 83% |
| Stamford Museum and Nature Center | 2 | 8 | 80% |
| Alaska State Museum | 2 | 5 | 71% |
| Hartwick College | 2 | 4 | 67% |
| Shiloh Museum of Ozark History | 2 | 4 | 67% |
| Kalamazoo Valley Museum | 2 | 3 | 60% |
| Indiana Univ. of Pennsylvania | 2 | 2 | 50% |
| Johnson-Humrickhouse Museum | 2 | 2 | 50% |
| Alma College | 2 | 1 | 33% |
| Artesia Historical Museum and Art Center | 2 | 1 | 33% |
| Chemung County Historical Society | 2 | 1 | 33% |
| McWane Science Center | 2 | 1 | 33% |
| City of Oakland Rotary Nature Center | 2 | 0 | 0% |
| Fellow-Reeve Museum of History and Science | 2 | 0 | 0% |
| Maine Historical Society | 2 | 0 | 0% |
| Pima Community College, Centre for Archaeological Field Training | 2 | 0 | 0% |
| Rutgers Univ. | 2 | 0 | 0% |
| Rutgers Univ. | 2 | 0 | 0% |
| Sharlot Hall Museum | 2 | 0 | 0% |
| Stuhr Museum of the Prairie Pioneer | 2 | 0 | 0% |
| The Heritage Museum of the Texas Hill Country | 2 | 0 | 0% |
| Univ. of Tennessee, Chattanooga | 2 | 0 | 0% |
| Washington County Historical Society | 2 | 0 | 0% |
| Western New Mexico Univ. Museum | 2 | 0 | 0% |
| Worcester Historical Museum | 2 | 0 | 0% |
| Cal. State, Sacramento | 1 | 1,707 | 100% |
| Univ. of Alaska, Anchorage | 1 | 126 | 99% |
| Univ. of Tulsa | 1 | 51 | 98% |
| Colgate Univ. | 1 | 41 | 98% |
| Univ. of the Pacific | 1 | 32 | 97% |
| Northwestern State Univ. of Louisiana | 1 | 11 | 92% |
| Dept. of Justice | 1 | 9 | 90% |
| Raymond M. Alf Museum of Paleontology | 1 | 8 | 89% |
| Saint Martin's Univ. Waynick Museum | 1 | 8 | 89% |
| Minnesota Historical Society | 1 | 4 | 80% |
| New Hampshire Division of Historical Resources | 1 | 4 | 80% |
| Staten Island Institute of Arts and Sciences | 1 | 4 | 80% |
| Cornell Univ. | 1 | 3 | 75% |
| Fort Hays State Univ. | 1 | 2 | 67% |
| Bonanzaville | 1 | 1 | 50% |
| Mabee-Gerrer Museum of Art | 1 | 1 | 50% |
| Morris Museum | 1 | 1 | 50% |
| Palo Alto Junior Museum and Zoo | 1 | 1 | 50% |
| Benton County Historical Society | 1 | 0 | 0% |
| Bixby Memorial Library | 1 | 0 | 0% |
| Cass County Historical Society Museum | 1 | 0 | 0% |
| City of Marietta | 1 | 0 | 0% |
| City of Santa Clara, Headen-Inman House | 1 | 0 | 0% |
| Crocker Art Museum | 1 | 0 | 0% |
| Dallas Historical Society | 1 | 0 | 0% |
| Davis and Elkins College | 1 | 0 | 0% |
| Everhart Museum | 1 | 0 | 0% |
| Fairbanks Museum and Planetarium | 1 | 0 | 0% |
| Fort Smith Museum of History | 1 | 0 | 0% |
| Fredericksburg Area Museum | 1 | 0 | 0% |
| Georgetown Univ. | 1 | 0 | 0% |
| Georgia Power | 1 | 0 | 0% |
| Grayson County Frontier Village Museum | 1 | 0 | 0% |
| Hobart and William Smith Colleges | 1 | 0 | 0% |
| Hutchinson County Historical Museum | 1 | 0 | 0% |
| Lane County Historical Museum | 1 | 0 | 0% |
| Meeteetse Museums | 1 | 0 | 0% |
| Miami County Museum | 1 | 0 | 0% |
| Miami-Dade County | 1 | 0 | 0% |
| Newark Museum | 1 | 0 | 0% |
| Oneida County Historical Society | 1 | 0 | 0% |
| Pember Library and Museum | 1 | 0 | 0% |
| Pierce County Medical Examiner's Office | 1 | 0 | 0% |
| Pocumtuck Valley Memorial Association | 1 | 0 | 0% |
| Sullivan County Historical Society, Inc. | 1 | 0 | 0% |
| Tread of Pioneers Museum | 1 | 0 | 0% |
| Univ. of Alabama, Birmingham | 1 | 0 | 0% |
| Univ. of Vermont | 1 | 0 | 0% |
| Wichita County Sherriff's Office | 1 | 0 | 0% |
| Bernice P. Bishop Museum | 0 | 1,636 | 100% |
| History Colorado | 0 | 1,186 | 100% |
| Univ. of Colorado Museum | 0 | 695 | 100% |
| Michigan State Univ. | 0 | 544 | 100% |
| Univ. of California, San Diego | 0 | 486 | 100% |
| San Jose State Univ. | 0 | 479 | 100% |
| Southern Methodist Univ. | 0 | 387 | 100% |
| Catalina Island Museum Society, Inc. | 0 | 369 | 100% |
| Florida Atlantic Univ. | 0 | 336 | 100% |
| Vanderbilt Univ. | 0 | 294 | 100% |
| Univ. of Washington | 0 | 284 | 100% |
| School for Advanced Research | 0 | 263 | 100% |
| State Historical Society of Iowa | 0 | 221 | 100% |
| Fernbank Museum of Natural History | 0 | 217 | 100% |
| Univ. of Minnesota, Twin Cities | 0 | 198 | 100% |
| Salmon Ruins Museum | 0 | 195 | 100% |
| HistoryMiami Museum | 0 | 188 | 100% |
| Univ. of Massachusetts, Amherst | 0 | 186 | 100% |
| Ojai Valley Historical Society and Museum | 0 | 180 | 100% |
| Univ. of Denver | 0 | 170 | 100% |
| Kansas State Univ. | 0 | 166 | 100% |
| Denver Museum of Nature and Science | 0 | 159 | 100% |
| College of William and Mary | 0 | 158 | 100% |
| Arkansas State Univ. Museum | 0 | 157 | 100% |
| Grand Valley State Univ. | 0 | 154 | 100% |
| Arkansas Highway and Transportation Dept. | 0 | 133 | 100% |
| Alabama Dept. of Archives & History | 0 | 115 | 100% |
| Univ. of Nevada, Las Vegas | 0 | 113 | 100% |
| Eastern Washington Univ. | 0 | 107 | 100% |
| Baylor Univ. | 0 | 105 | 100% |
| Rome Historical Society | 0 | 87 | 100% |
| Washington State Univ. | 0 | 83 | 100% |
| Colorado State Univ. | 0 | 79 | 100% |
| Murray State Univ. | 0 | 79 | 100% |
| Western Michigan Univ. | 0 | 79 | 100% |
| Maine State Museum | 0 | 76 | 100% |
| Bishop Museum of Science and Nature | 0 | 68 | 100% |
| Northwest Museum of Arts and Culture | 0 | 64 | 100% |
| Whitman College, Maxey Museum | 0 | 62 | 100% |
| Animas Museum | 0 | 61 | 100% |
| Univ. of North Dakota | 0 | 57 | 100% |
| Gregg County Historical Museum | 0 | 51 | 100% |
| Bess Bower Dunn Museum | 0 | 48 | 100% |
| Alabama Dept. of Transportation | 0 | 45 | 100% |
| Colorado College | 0 | 45 | 100% |
| SUNY, College at Oswego | 0 | 43 | 100% |
| Stephen F. Austin State Univ. | 0 | 42 | 100% |
| Indiana University-Purdue University Fort Wayne-Archaeological Survey | 0 | 38 | 100% |
| Wesleyan Univ. | 0 | 38 | 100% |
| Sydney L. Wright Museum | 0 | 37 | 100% |
| Hamilton County Dept. of Parks and Recreation | 0 | 34 | 100% |
| Indiana Dept. of Natural Resources | 0 | 33 | 100% |
| Pierce College | 0 | 31 | 100% |
| Univ. of Maine | 0 | 31 | 100% |
| Univ. of Northern Colorado | 0 | 31 | 100% |
| Fort Ticonderoga | 0 | 30 | 100% |
| SUNY, Univ. at Albany | 0 | 30 | 100% |
| Univ. of California, Santa Cruz | 0 | 29 | 100% |
| Columbus State Univ. | 0 | 28 | 100% |
| SUNY, Binghamton | 0 | 28 | 100% |
| Univ. of Puget Sound | 0 | 27 | 100% |
| Alutiiq Museum and Archaeological Repository | 0 | 23 | 100% |
| Detroit Institute of Arts | 0 | 23 | 100% |
| Georgia State Univ. | 0 | 23 | 100% |
| State Center Community College District - Fresno City College | 0 | 22 | 100% |
| Jacksonville State Univ. | 0 | 21 | 100% |
| Kutztown Univ. of Pennsylvania | 0 | 21 | 100% |
| Historical Society of Saginaw County | 0 | 20 | 100% |
| Princeton Univ. | 0 | 20 | 100% |
| Fort Collins Museum of Discovery | 0 | 19 | 100% |
| Pittsburg State Univ. | 0 | 19 | 100% |
| San Diego Archaeological Center | 0 | 19 | 100% |
| Science Museum of Minnesota | 0 | 19 | 100% |
| Bruce Museum | 0 | 18 | 100% |
| Los Angeles Pierce College | 0 | 18 | 100% |
| State Center Community College District - Reedly College | 0 | 18 | 100% |
| Univ. of Connecticut | 0 | 17 | 100% |
| Diablo Valley College | 0 | 16 | 100% |
| Lost City Museum | 0 | 16 | 100% |
| Oregon Parks and Recreation Department | 0 | 16 | 100% |
| Dept. of State | 0 | 16 | 100% |
| Arkansas Dept. of Parks and Tourism, Toltec Mounds Archeological Park | 0 | 15 | 100% |
| Carter County Museum | 0 | 15 | 100% |
| Michigan State Police | 0 | 15 | 100% |
| Museum of the American Indian | 0 | 15 | 100% |
| Cochise College | 0 | 14 | 100% |
| Columbia Univ. | 0 | 14 | 100% |
| Pratt Museum | 0 | 14 | 100% |
| Vassar College | 0 | 14 | 100% |
| Antelope Valley College | 0 | 13 | 100% |
| Kikuchi Center, Kaua'i Community College | 0 | 13 | 100% |
| Metropolitan State Univ. of Denver | 0 | 13 | 100% |
| Michigan Dept. of Transportation | 0 | 13 | 100% |
| Washington State Historical Society | 0 | 13 | 100% |
| Indiana Dept. of Transportation | 0 | 12 | 100% |
| Univ. of New Hampshire | 0 | 12 | 100% |
| Weber State Univ. | 0 | 12 | 100% |
| Franklin Pierce University | 0 | 11 | 100% |
| Michigan History Center | 0 | 11 | 100% |
| Univ. of Hawai'i at Hilo | 0 | 11 | 100% |
| Amherst College | 0 | 10 | 100% |
| Culver-Stockton College | 0 | 10 | 100% |
| Dallas Water Utilities | 0 | 10 | 100% |
| Karshner Museum | 0 | 10 | 100% |
| Nevada Historical Society | 0 | 10 | 100% |
| New York State Office of Parks, Recreation and Historic Preservation | 0 | 10 | 100% |
| Allen County Museum, Fort Wayne Historical Society | 0 | 9 | 100% |
| Besser Museum for Northeast Michigan | 0 | 9 | 100% |
| Florida Dept. of Transportation | 0 | 9 | 100% |
| Lakeshore Museum Center | 0 | 9 | 100% |
| Oregon Health & Sciences Univ. | 0 | 9 | 100% |
| Sloan Museum | 0 | 9 | 100% |
| Virginia Commonwealth Univ. | 0 | 9 | 100% |
| American Univ. | 0 | 8 | 100% |
| Chadron State College | 0 | 8 | 100% |
| City of Evansville Water and Sewer Utility | 0 | 8 | 100% |
| City of Larsen Bay | 0 | 8 | 100% |
| County of Nacogdoches | 0 | 8 | 100% |
| Michigan Dept. of Natural Resources | 0 | 8 | 100% |
| Museum of Ojibwa Culture and Marquette Mission Park - City of St. Ignace | 0 | 8 | 100% |
| Northern Arizona Univ. | 0 | 8 | 100% |
| SUNY, New Paltz | 0 | 8 | 100% |
| Toledo Zoological Society | 0 | 8 | 100% |
| Abbe Museum | 0 | 7 | 100% |
| Appalachian State Univ. | 0 | 7 | 100% |
| Coe College | 0 | 7 | 100% |
| Colorado Archaeological Society, Denver Chapter | 0 | 7 | 100% |
| Albuquerque Museum | 0 | 6 | 100% |
| Cal. State, Los Angeles | 0 | 6 | 100% |
| MetroParks of the Toledo Area | 0 | 6 | 100% |
| Placer County Museums | 0 | 6 | 100% |
| Sheboygan County Historical Museum | 0 | 6 | 100% |
| Arizona State Land Dept. | 0 | 5 | 100% |
| Coachella Valley History Museum | 0 | 5 | 100% |
| Douglas County Public Utility District | 0 | 5 | 100% |
| Fruitlands Museums | 0 | 5 | 100% |
| Northern Illinois Univ. | 0 | 5 | 100% |
| Pomona College | 0 | 5 | 100% |
| Rice Univ., Dept. of Anthropology | 0 | 5 | 100% |
| Sul Ross State Univ. | 0 | 5 | 100% |
| Univ. of Virginia | 0 | 5 | 100% |
| Anchorage Museum | 0 | 4 | 100% |
| Berkshire Museum | 0 | 4 | 100% |
| Catholic Univ. of America | 0 | 4 | 100% |
| Colorado Springs Pioneers Museum | 0 | 4 | 100% |
| Dickinson State Univ. | 0 | 4 | 100% |
| Greater Amsterdam School District | 0 | 4 | 100% |
| Historic Westville | 0 | 4 | 100% |
| Idaho Dept. of Transportation | 0 | 4 | 100% |
| Lindsay Wildlife Museum | 0 | 4 | 100% |
| Los Rios Community College District | 0 | 4 | 100% |
| Oberlin College | 0 | 4 | 100% |
| Pacific Lutheran Univ. | 0 | 4 | 100% |
| Seminole Tribe of Florida | 0 | 4 | 100% |
| Syracuse Univ. | 0 | 4 | 100% |
| Valentine Museum | 0 | 4 | 100% |
| Virginia Dept. of Conservation and Recreation, Division of State Parks | 0 | 4 | 100% |
| Wistar Institute | 0 | 4 | 100% |
| Boston Univ. | 0 | 3 | 100% |
| Brooklyn Children's Museum | 0 | 3 | 100% |
| Bryn Mawr College | 0 | 3 | 100% |
| City of Saugatuck | 0 | 3 | 100% |
| Colorado Bureau of Investigation | 0 | 3 | 100% |
| Georgia Dept. of Transportation | 0 | 3 | 100% |
| Kodiak History Museum | 0 | 3 | 100% |
| Madison County Coroner's Office | 0 | 3 | 100% |
| Manchester Historical Society | 0 | 3 | 100% |
| Outagamie County Historical Society | 0 | 3 | 100% |
| Pima County Office of the Medical Examiner | 0 | 3 | 100% |
| Pioneer Historical Society of Bent County | 0 | 3 | 100% |
| Pioneer Museum, Blue Licks Battlefield State Resort Park | 0 | 3 | 100% |
| Plimoth Patuxet Museum | 0 | 3 | 100% |
| Robbins Museum of Archaeology | 0 | 3 | 100% |
| Schiele Museum of Natural History | 0 | 3 | 100% |
| Texarkana Museums System | 0 | 3 | 100% |
| Univ. of San Diego | 0 | 3 | 100% |
| Virginia Living Museum | 0 | 3 | 100% |
| Warren County Cultural and Heritage Commission, Shippen Manor | 0 | 3 | 100% |
| Wasco County Dalles City Museum Commission | 0 | 3 | 100% |
| Arizona Capitol Museum | 0 | 2 | 100% |
| Augusta State Univ. | 0 | 2 | 100% |
| Aurora History Museum and Historic Sites | 0 | 2 | 100% |
| Birmingham Museum of Art | 0 | 2 | 100% |
| Boston Children's Museum | 0 | 2 | 100% |
| Cape Girardeau County Sheriff's Office | 0 | 2 | 100% |
| Chelan County Public Utilities District | 0 | 2 | 100% |
| Children's Museum of Oak Ridge | 0 | 2 | 100% |
| City of Traverse City | 0 | 2 | 100% |
| Columbia Gorge Discovery Center and Museum | 0 | 2 | 100% |
| Cosumnes River College | 0 | 2 | 100% |
| Cumberland Univ. | 0 | 2 | 100% |
| Emory Univ. | 0 | 2 | 100% |
| Evanston History Center | 0 | 2 | 100% |
| Hawai'i Maritime Center | 0 | 2 | 100% |
| Historic Hugeuenot Street | 0 | 2 | 100% |
| John Michael Kohler Arts Center | 0 | 2 | 100% |
| Kamehameha Schools | 0 | 2 | 100% |
| Kentucky Historical Society | 0 | 2 | 100% |
| Kitsap County Coroner's Office | 0 | 2 | 100% |
| Moravian Historical Society | 0 | 2 | 100% |
| Museum of the Great Plains | 0 | 2 | 100% |
| Northwest Christian College | 0 | 2 | 100% |
| Oregon Museum of Science and Industry | 0 | 2 | 100% |
| Pejepscot Historical Society | 0 | 2 | 100% |
| Pilgrim Hall Museum | 0 | 2 | 100% |
| Reading Public Museum | 0 | 2 | 100% |
| SUNY Broome Community College | 0 | 2 | 100% |
| San Bernardino County Sherriff-Coroner | 0 | 2 | 100% |
| San Luis Obispo County Archaeological Society | 0 | 2 | 100% |
| Southern Oregon Historical Society | 0 | 2 | 100% |
| Southwestern College | 0 | 2 | 100% |
| St. Louis County Office of the Medical Examiner | 0 | 2 | 100% |
| State Historical Society of North Dakota | 0 | 2 | 100% |
| Tioga County Historical Society | 0 | 2 | 100% |
| Dept. of Homeland Security | 0 | 2 | 100% |
| Univ. of West Georgia | 0 | 2 | 100% |
| Univ. of Wisconsin, Stevens Point | 0 | 2 | 100% |
| Washington State Dept of Natural Resources | 0 | 2 | 100% |
| Adams State Univ. | 0 | 1 | 100% |
| Arizona State Parks and Trails | 0 | 1 | 100% |
| Athens County Historical Society and Museum | 0 | 1 | 100% |
| Bay County Historical Society | 0 | 1 | 100% |
| Berrien County Sheriff's Office | 0 | 1 | 100% |
| Buffalo Bill Museum and Grave | 0 | 1 | 100% |
| California Academy of Sciences | 0 | 1 | 100% |
| Central Methodist Univ. | 0 | 1 | 100% |
| Charles Whipple Green Museum, George Hail Library | 0 | 1 | 100% |
| Chicago History Museum | 0 | 1 | 100% |
| Clarke Historical Museum | 0 | 1 | 100% |
| Dalton State College | 0 | 1 | 100% |
| Dana Adobe Nipomo Amigos | 0 | 1 | 100% |
| Delta County Historical Society Museum | 0 | 1 | 100% |
| Denver Art Museum | 0 | 1 | 100% |
| Ecotarium | 0 | 1 | 100% |
| Florence Indian Mound Museum | 0 | 1 | 100% |
| Folsom History Museum | 0 | 1 | 100% |
| Fremont County Coroner | 0 | 1 | 100% |
| Geneva Historical Society | 0 | 1 | 100% |
| Gettysburg Foundation | 0 | 1 | 100% |
| History Museum on the Square | 0 | 1 | 100% |
| Kerr County | 0 | 1 | 100% |
| Lambertville Historical Society | 0 | 1 | 100% |
| Library Company of Philadelphia | 0 | 1 | 100% |
| Michigan Technological Univ. | 0 | 1 | 100% |
| Minneapolis Institute of Art | 0 | 1 | 100% |
| Montclair Art Museum | 0 | 1 | 100% |
| Monterey Peninsula College | 0 | 1 | 100% |
| Mount Holyoke College Art Museum | 0 | 1 | 100% |
| Museum of Science Boston | 0 | 1 | 100% |
| Perry County Coroner's Office | 0 | 1 | 100% |
| Port Huron Museum | 0 | 1 | 100% |
| Renton History Museum | 0 | 1 | 100% |
| Rhinelander High School | 0 | 1 | 100% |
| Rhode Island Historical Society | 0 | 1 | 100% |
| SUNY, Potsdam | 0 | 1 | 100% |
| Sabine River Authority of Texas | 0 | 1 | 100% |
| Safety Harbor Museum of Natural History | 0 | 1 | 100% |
| Sandusky Library, Follett House Museum | 0 | 1 | 100% |
| Seneca Falls Historical Society | 0 | 1 | 100% |
| Sierra Mono Museum | 0 | 1 | 100% |
| Sioux City Public Museum | 0 | 1 | 100% |
| St Joseph County Sheriff's Dept. | 0 | 1 | 100% |
| St. Lawrence Univ. | 0 | 1 | 100% |
| Stoddard County Sheriff's Office | 0 | 1 | 100% |
| The Region of Three Oaks Museum | 0 | 1 | 100% |
| Town of Germantown | 0 | 1 | 100% |
| Univ. of Southern California | 0 | 1 | 100% |
| Univ. of North Carolina, Charlotte | 0 | 1 | 100% |
| Wickliffe Mounds State Historic Site | 0 | 1 | 100% |
| Wistariahurst Museum | 0 | 1 | 100% |
Tribes that institutions made Native American remains available to
| Tribe | Remains Made Available for Return to Tribe |
|---|---|
| Chickasaw Nation | 25,445 |
| Muscogee (Creek) Nation | 20,573 |
| Hopi Tribe of Arizona | 18,480 |
| Alabama-Coushatta Tribe of Texas | 18,100 |
| Coushatta Tribe of Louisiana | 17,910 |
| Choctaw Nation of Oklahoma | 16,986 |
| The Seminole Nation of Oklahoma | 16,866 |
| Jena Band of Choctaw Indians | 16,275 |
| Zuni Tribe of the Zuni Reservation, New Mexico | 15,926 |
| Alabama-Quassarte Tribal Town, Oklahoma | 14,113 |
| Seminole Tribe of Florida | 12,714 |
| Eastern Band of Cherokee Indians | 11,202 |
| United Keetoowah Band of Cherokee Indians in Oklahoma | 10,628 |
| Cherokee Nation | 10,480 |
| Shawnee Tribe | 9,793 |
| Absentee-Shawnee Tribe of Indians of Oklahoma | 9,652 |
| Eastern Shawnee Tribe of Oklahoma | 9,639 |
| Pueblo of Jemez, New Mexico | 9,295 |
| Ione Band of Miwok Indians of California | 7,464 |
| Wilton Rancheria, California | 7,410 |
| Shingle Springs Band of Miwok Indians, Shingle Springs Rancheria (Verona Tract), California | 7,392 |
| Buena Vista Rancheria of Me-Wuk Indians of California | 7,371 |
| Thlopthlocco Tribal Town | 7,261 |
| Chicken Ranch Rancheria of Me-Wuk Indians of California | 7,245 |
| Jackson Band of Miwuk Indians | 7,131 |
| Santa Ynez Band of Chumash Mission Indians of the Santa Ynez Reservation, California | 6,907 |
| Poarch Band of Creek Indians | 6,700 |
| Three Affiliated Tribes of the Fort Berthold Reservation, North Dakota | 6,579 |
| Pueblo of Acoma, New Mexico | 6,523 |
| Tuolumne Band of Me-Wuk Indians of the Tuolumne Rancheria of California | 6,064 |
| Santa Rosa Indian Community of the Santa Rosa Rancheria, California | 6,005 |
| Kialegee Tribal Town | 5,984 |
| Winnebago Tribe of Nebraska | 5,979 |
| Pueblo of Taos, New Mexico | 5,964 |
| Picayune Rancheria of Chukchansi Indians of California | 5,921 |
| Table Mountain Rancheria | 5,909 |
| Tule River Indian Tribe of the Tule River Reservation, California | 5,909 |
| California Valley Miwok Tribe, California | 5,785 |
| Pueblo of Isleta, New Mexico | 5,730 |
| Gila River Indian Community of the Gila River Indian Reservation, Arizona | 5,691 |
| Salt River Pima-Maricopa Indian Community of the Salt River Reservation, Arizona | 5,685 |
| Tohono O'odham Nation of Arizona | 5,535 |
| Ak-Chin Indian Community | 5,486 |
| Pueblo of Sandia, New Mexico | 5,400 |
| Iowa Tribe of Kansas and Nebraska | 5,259 |
| Santo Domingo Pueblo | 5,245 |
| Pueblo of Laguna, New Mexico | 5,133 |
| Pueblo of Picuris, New Mexico | 5,131 |
| Iowa Tribe of Oklahoma | 4,950 |
| Miami Tribe of Oklahoma | 4,926 |
| Pueblo of Santa Clara, New Mexico | 4,926 |
| Pueblo of San Ildefonso, New Mexico | 4,918 |
| Ysleta del Sur Pueblo | 4,899 |
| Pueblo of Pojoaque, New Mexico | 4,887 |
| Prairie Band of Potawatomi Nation | 4,872 |
| Pueblo of Tesuque, New Mexico | 4,857 |
| Pueblo of Zia, New Mexico | 4,856 |
| Pueblo of Nambe, New Mexico | 4,853 |
| Quapaw Nation | 4,845 |
| Ho-Chunk Nation of Wisconsin | 4,708 |
| Middletown Rancheria of Pomo Indians of California | 4,706 |
| Ohkay Owingeh, New Mexico (formerly the Pueblo of San Juan) | 4,691 |
| Pueblo of Santa Ana, New Mexico | 4,683 |
| Pueblo of Cochiti, New Mexico | 4,600 |
| Guidiville Rancheria of California | 4,557 |
| Yankton Sioux Tribe of South Dakota | 4,439 |
| Pokagon Band of Potawatomi Indians, Michigan and Indiana | 4,424 |
| Pueblo of San Felipe, New Mexico | 4,420 |
| Pawnee Nation of Oklahoma | 4,385 |
| Otoe-Missouria Tribe of Indians, Oklahoma | 4,369 |
| Turtle Mountain Band of Chippewa Indians of North Dakota | 4,352 |
| Peoria Tribe of Indians of Oklahoma | 4,297 |
| Santee Sioux Nation, Nebraska | 4,296 |
| Match-e-be-nash-she-wish Band of Pottawatomi Indians of Michigan | 4,262 |
| Delaware Tribe of Indians | 4,233 |
| Delaware Nation, Oklahoma | 4,231 |
| Fond du Lac Band of the Minnesota Chippewa Tribe, Minnesota | 4,049 |
| Nottawaseppi Huron Band of the Potawatomi, Michigan (formerly the Huron Potawatomi, Inc.) | 4,017 |
| Sisseton-Wahpeton Oyate of the Lake Traverse Reservation, South Dakota | 3,874 |
| Caddo Nation of Oklahoma | 3,776 |
| Forest County Potawatomi Community, Wisconsin | 3,728 |
| Wichita and Affiliated Tribes (Wichita, Keechi, Waco and Tawakonie), Oklahoma | 3,713 |
| Osage Nation | 3,662 |
| Sac and Fox Nation, Oklahoma | 3,644 |
| Mille Lacs Band of the Minnesota Chippewa Tribe, Minnesota | 3,634 |
| Sac and Fox Tribe of the Mississippi in Iowa | 3,601 |
| Seneca Nation of Indians | 3,579 |
| Tonawanda Band of Seneca | 3,564 |
| Seneca-Cayuga Nation | 3,553 |
| Sac and Fox Nation of Missouri in Kansas and Nebraska | 3,533 |
| White Earth Band of Minnesota Chippewa Tribe, Minnesota | 3,508 |
| Leech Lake Band of the Minnesota Chippewa Tribe, Minnesota | 3,507 |
| Navajo Nation, Arizona, New Mexico and Utah | 3,473 |
| Bois Forte Band (Nett Lake) of the Minnesota Chippewa Tribe, Minnesota | 3,443 |
| Grand Portage Band of the Minnesota Chippewa Tribe, Minnesota | 3,438 |
| Hui Malama I Na Kupuna O Hawai'i Nei | 3,431 |
| Red Lake Band of Chippewa Indians, Minnesota | 3,396 |
| Omaha Tribe of Nebraska | 3,386 |
| Office of Hawaiian Affairs | 3,383 |
| Ponca Tribe of Indians of Oklahoma | 3,289 |
| Chippewa Cree Indians of the Rocky Boy's Reservation, Montana | 3,262 |
| Oglala Sioux Tribe | 3,209 |
| Rosebud Sioux Tribe of the Rosebud Indian Reservation, South Dakota | 3,061 |
| Spirit Lake Tribe, North Dakota | 3,031 |
| Kickapoo Tribe of Indians of the Kickapoo Reservation in Kansas | 2,999 |
| Keweenaw Bay Indian Community, Michigan | 2,983 |
| Saginaw Chippewa Indian Tribe of Michigan | 2,977 |
| Lac Vieux Desert Band of Lake Superior Chippewa Indians of Michigan | 2,921 |
| O'ahu Island Burial Council | 2,886 |
| Citizen Potawatomi Nation, Oklahoma | 2,859 |
| Sault Ste. Marie Tribe of Chippewa Indians, Michigan | 2,802 |
| Assiniboine and Sioux Tribes of the Fort Peck Indian Reservation, Montana | 2,800 |
| Lower Sioux Indian Community in the State of Minnesota | 2,791 |
| Wyandotte Nation | 2,763 |
| Cheyenne River Sioux Tribe of the Cheyenne River Reservation, South Dakota | 2,732 |
| Bay Mills Indian Community, Michigan | 2,729 |
| United Auburn Indian Community of the Auburn Rancheria of California | 2,722 |
| Hannahville Indian Community, Michigan | 2,716 |
| Stockbridge Munsee Community, Wisconsin | 2,665 |
| Minnesota Chippewa Tribe, Minnesota | 2,650 |
| Ka Lahui Hawaii | 2,644 |
| Grand Traverse Band of Ottawa and Chippewa Indians, Michigan | 2,630 |
| Ponca Tribe of Nebraska | 2,620 |
| Standing Rock Sioux Tribe of North and South Dakota | 2,606 |
| Onondaga Nation | 2,476 |
| Upper Sioux Community, Minnesota | 2,382 |
| Prairie Island Indian Community in the State of Minnesota | 2,373 |
| Lac Courte Oreilles Band of Lake Superior Chippewa Indians of Wisconsin | 2,333 |
| Little Traverse Bay Bands of Odawa Indians, Michigan | 2,316 |
| Red Cliff Band of Lake Superior Chippewa Indians of Wisconsin | 2,295 |
| Bad River Band of the Lake Superior Tribe of Chippewa Indians of the Bad River Reservation, Wisconsin | 2,293 |
| Little River Band of Ottawa Indians, Michigan | 2,273 |
| Sokaogon Chippewa Community, Wisconsin | 2,245 |
| Lac du Flambeau Band of Lake Superior Chippewa Indians of the Lac du Flambeau Reservation of Wisconsin | 2,225 |
| Oneida Indian Nation in New York | 2,223 |
| St. Croix Chippewa Indians of Wisconsin | 2,202 |
| Kickapoo Tribe of Oklahoma | 2,193 |
| Shakopee Mdewakanton Sioux Community of Minnesota | 2,085 |
| Comanche Nation, Oklahoma | 2,081 |
| Oneida Nation of Wisconsin | 2,081 |
| Saint Regis Mohawk Tribe | 2,074 |
| Tuscarora Nation | 2,050 |
| Flandreau Santee Sioux Tribe of South Dakota | 2,028 |
| Cayuga Nation | 1,966 |
| Crow Creek Sioux Tribe of the Crow Creek Reservation, South Dakota | 1,837 |
| Ottawa Tribe of Oklahoma | 1,756 |
| Kiowa Indian Tribe of Oklahoma | 1,635 |
| Cheyenne and Arapaho Tribes, Oklahoma | 1,632 |
| Northern Cheyenne Tribe of the Northern Cheyenne Indian Reservation, Montana | 1,598 |
| Kekumano 'Ohana | 1,585 |
| Ko'olauloa Hawaiian Civic Club | 1,582 |
| Van Horn Diamond 'Ohana | 1,582 |
| Ute Mountain Ute Tribe | 1,575 |
| Confederated Tribes and Bands of the Yakama Nation | 1,563 |
| Mississippi Band of Choctaw Indians | 1,455 |
| Confederated Tribes of the Warm Springs Reservation of Oregon | 1,438 |
| Kickapoo Traditional Tribe of Texas | 1,432 |
| Kaw Nation, Oklahoma | 1,392 |
| Lower Brule Sioux Tribe of the Lower Brule Reservation, South Dakota | 1,336 |
| Southern Ute Indian Tribe of the Southern Ute Reservation, Colorado | 1,334 |
| Mescalero Apache Tribe of the Mescalero Reservation, New Mexico | 1,250 |
| Chitimacha Tribe of Louisiana | 1,244 |
| Northern Arapaho Tribe of the Wind River Reservation, Wyoming | 1,218 |
| Kah-Bay-Kah-Nong (Warroad Chippewa) | 1,173 |
| Mendota Mdewakanton Dakota Community | 1,173 |
| Miccosukee Tribe of Indians | 1,166 |
| Apache Tribe of Oklahoma | 1,095 |
| Fort Sill Apache Tribe of Oklahoma | 1,055 |
| Crow Tribe of Montana | 996 |
| Confederated Tribes of the Umatilla Indian Reservation | 989 |
| Confederated Tribes of the Colville Reservation | 988 |
| Federated Indians of Graton Rancheria, California | 987 |
| Kamehameha School | 959 |
| Nahoa 'Olelo O Kamehameha Society | 957 |
| Alu Like, Inc. | 954 |
| Daughters and Sons of Hawaiian Warriors | 954 |
| Hawaiian Civic Clubs of Honolulu | 954 |
| Royal Order of Kamehameha I | 954 |
| Nez Perce Tribe | 926 |
| Little Shell Tribe of Chippewa Indians of Montana | 902 |
| Wampanoag Tribe of Gay Head (Aquinnah) | 883 |
| Pechanga Band of Indians | 853 |
| Tunica-Biloxi Indian Tribe | 801 |
| Menominee Indian Tribe of Wisconsin | 779 |
| White Mountain Apache Tribe of the Fort Apache Reservation, Arizona | 776 |
| Quechan Tribe of the Fort Yuma Indian Reservation, California and Arizona | 770 |
| Point Hope, Native Village of | 764 |
| Rincon Band of Luiseno Indians | 744 |
| Pauma Band of Luiseno Mission Indians of the Pauma and Yuima Reservation, California | 743 |
| Ute Indian Tribe of the Uintah and Ouray Reservation, Utah | 725 |
| Mechoopda Indian Tribe of Chico Rancheria, California | 710 |
| Mashpee Wampanoag Tribe | 701 |
| Jicarilla Apache Nation, New Mexico | 700 |
| Fort McDowell Yavapai Nation, Arizona | 563 |
| Yavapai-Prescott Indian Tribe | 542 |
| Round Valley Indian Tribes of the Round Valley Reservation, California | 529 |
| Yocha Dehe Wintun Nation, California | 517 |
| San Pasqual Band of Diegueno Mission Indians of California | 501 |
| Cachil DeHe Band of Wintun Indians of the Colusa Indian Community of the Colusa Rancheria, California | 498 |
| Mooretown Rancheria of Maidu Indians of California | 493 |
| Campo Band of Diegueno Mission Indians of the Campo Indian Reservation, California | 490 |
| Jamul Indian Village of California | 489 |
| Capitan Grande Band of Diegueno Mission Indians of California | 488 |
| Ewiiaapaayp Band of Kumeyaay Indians, California | 488 |
| Inaja Band of Diegueno Mission Indians of the Inaja and Cosmit Reservation, California | 488 |
| La Posta Band of Diegueno Mission Indians of the La Posta Indian Reservation, California | 488 |
| Manzanita Band of Diegueno Mission Indians of the Manzanita Reservation, California | 488 |
| Mesa Grande Band of Diegueno Mission Indians of the Mesa Grande Reservation, California | 488 |
| Confederated Tribes of Siletz Indians of Oregon | 487 |
| Iipay Nation of Santa Ysabel, California | 487 |
| Sycuan Band of the Kumeyaay Nation | 487 |
| Jamestown S'Klallam Tribe | 476 |
| Port Gamble S'Klallam Tribe | 468 |
| Lower Elwha Tribal Community | 467 |
| Klamath Tribes | 426 |
| Kauai/Niihau Island Burial Council | 423 |
| Confederated Tribes of the Grand Ronde Community of Oregon | 419 |
| Berry Creek Rancheria of Maidu Indians of California | 416 |
| Enterprise Rancheria of Maidu Indians of California | 411 |
| Kletsel Dehe Wintun of the Cortina Rancheria | 405 |
| El Dorado Miwok Rancheria | 371 |
| Paskenta Band of Nomlaki Indians of California | 370 |
| Catawba Indian Nation | 362 |
| Maui/Lanai Island Burial Council | 362 |
| Pyramid Lake Paiute Tribe of the Pyramid Lake Reservation, Nevada | 342 |
| Nikolski, Native Village of | 334 |
| Hawaii Island Burial Council | 326 |
| Nashville-El Dorado Miwok | 320 |
| Barrow Inupiat Traditional Government, Native Village of | 318 |
| San Carlos Apache Tribe of the San Carlos Reservation, Arizona | 315 |
| Tonkawa Tribe of Indians of Oklahoma | 313 |
| Paiute-Shoshone Tribe of the Fallon Reservation and Colony, Nevada | 310 |
| Penobscot Nation | 305 |
| Tonto Apache Tribe of Arizona | 304 |
| Paiute Indian Tribe of Utah | 303 |
| Gambell, Native Village of | 296 |
| Assonet Band of the Wampanoag Nation | 288 |
| Wanapum Band | 287 |
| Narragansett Indian Tribe | 279 |
| Kaibab Band of Paiute Indians of the Kaibab Indian Reservation, Arizona | 270 |
| Molokai Island Burial Council | 269 |
| Nansemond Indian Nation | 264 |
| Yavapai-Apache Nation of the Camp Verde Indian Reservation, Arizona | 264 |
| Grindstone Indian Rancheria of Wintun-Wailaki Indians of California | 258 |
| Northfork Rancheria of Mono Indians of California | 241 |
| Hualapai Indian Tribe of the Hualapai Indian Reservation, Arizona | 239 |
| Lummi Tribe of the Lummi Reservation | 233 |
| Modoc Nation | 233 |
| Passamaquoddy Tribe of Maine | 233 |
| Eastern Shoshone Tribe of the Wind River Reservation, Wyoming | 222 |
| Hui Malama Pono 'O Lanai | 215 |
| Mi'kmaq Nation | 215 |
| Cold Springs Rancheria of Mono Indians of California | 213 |
| Houlton Band of Maliseet Indians | 211 |
| Pamunkey Indian Tribe | 209 |
| Upper Mattaponi Tribe | 207 |
| Chickahominy Indian Tribe | 206 |
| Big Sandy Rancheria of Western Mono Indians of California | 205 |
| Soboba Band of Luiseno Indians, California | 203 |
| Redding Rancheria, California | 202 |
| Cher-Ae Heights Indian Community of the Trinidad Rancheria, California | 201 |
| Chickahominy Indian Tribe - Eastern Division | 200 |
| Pala Band of Mission Indians | 200 |
| Rappahannock Tribe, Inc. | 200 |
| Scotts Valley Band of Pomo Indians of California | 198 |
| Elem Indian Colony of Pomo Indians of the Sulphur Bank Rancheria, California | 196 |
| Swinomish Indian Tribal Community | 196 |
| La Jolla Band of Luiseno Indians, California | 195 |
| Chugach Alaska Corporation | 186 |
| Yuhaaviatam of San Manuel Nation | 185 |
| Tulalip Tribes of Washington | 183 |
| Haudenosaunee Confederacy | 182 |
| Stillaguamish Tribe of Indians of Washington | 182 |
| Fort Belknap Indian Community of the Fort Belknap Reservation of Montana | 179 |
| Fort McDermitt Paiute and Shoshone Tribes of the Fort McDermitt Indian Reservation, Nevada and Oregon | 171 |
| Shoshone-Bannock Tribes of the Fort Hall Reservation | 170 |
| Moapa Band of Paiute Indians of the Moapa River Indian Reservation, Nevada | 163 |
| Puyallup Tribe of the Puyallup Reservation | 163 |
| Las Vegas Tribe of Paiute Indians of the Las Vegas Indian Colony, Nevada | 161 |
| Monacan Indian Tribe | 161 |
| San Juan Southern Paiute Tribe of Arizona | 157 |
| Burns Paiute Tribe | 154 |
| Abenaki Nation of Missisquoi | 151 |
| Department of Hawaiian Homelands | 151 |
| Washoe Tribe of Nevada & California | 151 |
| Samish Indian Nation | 149 |
| Morongo Band of Mission Indians, California | 141 |
| Port Graham, Native Village of | 135 |
| Yerington Paiute Tribe of the Yerington Colony and Campbell Ranch, Nevada | 135 |
| Abenaki Nation of New Hampshire | 133 |
| Pit River Tribe, California | 133 |
| Shoshone-Paiute Tribes of the Duck Valley Reservation, Nevada | 133 |
| Reno-Sparks Indian Colony, Nevada | 132 |
| Seldovia Village Tribe | 132 |
| Sun'aq Tribe of Kodiak | 129 |
| Suquamish Indian Tribe of the Port Madison Reservation, Washington | 124 |
| Timbisha Shoshone Tribe | 124 |
| Wiyot Tribe, California | 123 |
| Ukpeagvik Inupiat Corporation | 122 |
| Nanwalek, Native Village of (aka English Bay) | 120 |
| Upper Skagit Indian Tribe | 120 |
| Walker River Paiute Tribe of the Walker River Reservation, Nevada | 120 |
| Havasupai Tribe of the Havasupai Reservation, Arizona | 117 |
| Confederated Tribes of the Chehalis Reservation | 115 |
| Shinnecock Indian Nation | 115 |
| Te-Moak Tribe of Western Shoshone Indians of Nevada | 115 |
| Fort Independence Indian Community of Paiute Indians of the Fort Independence Reservation, California | 112 |
| Nooksack Indian Tribe | 111 |
| Coquille Indian Tribe | 110 |
| Muckleshoot Indian Tribe | 110 |
| Northwestern Band of Shoshoni Nation | 110 |
| Nipmuc Nation | 109 |
| Susanville Indian Rancheria, California | 108 |
| Duckwater Shoshone Tribe of the Duckwater Reservation, Nevada | 107 |
| Alutiiq Tribe of Old Harbor | 106 |
| Torres Martinez Desert Cahuilla Indians, California | 105 |
| Grand River Band of Ottawa Indians | 104 |
| Nisqually Indian Tribe | 104 |
| Cowasuck Band of the Pennacook-Abenaki People | 103 |
| Association of Hawaiian Civic Clubs | 101 |
| Colorado River Indian Tribes of the Colorado River Indian Reservation, Arizona and California | 101 |
| Santa Rosa Band of Cahuilla Indians, California | 100 |
| Yomba Shoshone Tribe of the Yomba Reservation, Nevada | 100 |
| Shoalwater Bay Indian Tribe of the Shoalwater Bay Indian Reservation | 98 |
| Blackfeet Tribe of the Blackfeet Indian Reservation of Montana | 97 |
| Ely Shoshone Tribe of Nevada | 97 |
| Savoonga, Native Village of | 97 |
| Bishop Paiute Tribe | 96 |
| Chaubunagungamaug Nipmuck | 95 |
| Elnu Tribe of the Abenaki of VT | 95 |
| Koasek (Cowasuck) Traditional Band of the Koas Abenaki Nation of VT | 95 |
| Koasek Traditional Band of the Sovereign Abenaki Nation of VT | 95 |
| Nulhegan Band of the Coosuk-Abenaki Nation of VT | 95 |
| St. Francis/Sokoki Band of VT | 95 |
| Agua Caliente Band of Cahuilla Indians of the Agua Caliente Indian Reservation, California | 94 |
| Cowlitz Indian Tribe | 94 |
| Cahuilla Band of Indians | 90 |
| Los Coyotes Band of Cahuilla and Cupeno Indians, California | 90 |
| Ramona Band of Cahuilla, California | 90 |
| Spokane Tribe of the Spokane Reservation | 90 |
| Cabazon Band of Cahuilla Indians | 89 |
| Blue Lake Rancheria, California | 88 |
| Bear River Band of the Rohnerville Rancheria, California | 86 |
| Qawalangin Tribe of Unalaska | 86 |
| Confederated Tribes of the Goshute Reservation, Nevada and Utah | 85 |
| Snoqualmie Indian Tribe | 85 |
| Koniag, Inc. | 84 |
| Skull Valley Band of Goshute Indians of Utah | 83 |
| Lovelock Paiute Tribe of the Lovelock Indian Colony, Nevada | 82 |
| Elk Valley Rancheria, California | 81 |
| Fort Mojave Indian Tribe of Arizona, California and Nevada | 81 |
| Lone Pine Paiute-Shoshone Tribe | 77 |
| Mohegan Tribe of Indians of Connecticut | 75 |
| Piro-Manso-Tiwa Tribe | 75 |
| Confederated Tribes of the Coos, Lower Umpqua and Siuslaw Indians of Oregon | 74 |
| Big Pine Paiute Tribe of the Owens Valley | 71 |
| Mohawk Nation Council of Chiefs Akwesasne | 69 |
| Quinault Indian Nation | 68 |
| Summit Lake Paiute Tribe of Nevada | 68 |
| Kotzebue, Native Village of | 67 |
| Alturas Indian Rancheria, California | 66 |
| Hui Alanui O Makena | 66 |
| Nakupuna O Maui | 66 |
| Bridgeport Indian Colony | 65 |
| Augustine Band of Cahuilla Indians, California | 64 |
| Greenville Rancheria | 64 |
| Kalispel Indian Community of the Kalispel Reservation | 64 |
| Winnemucca Indian Colony of Nevada | 63 |
| Larsen Bay, Native Village of | 62 |
| Tolowa Dee-ni' Nation | 62 |
| Sauk-Suiattle Indian Tribe | 61 |
| Skokomish Indian Tribe | 61 |
| Coeur D'Alene Tribe | 60 |
| Old Harbor Native Corporation | 58 |
| Makah Indian Tribe of the Makah Indian Reservation | 57 |
| Utu Utu Gwaitu Paiute Tribe of the Benton Paiute Reservation, California | 56 |
| Chemehuevi Indian Tribe of the Chemehuevi Reservation, California | 55 |
| Squaxin Island Tribe of the Squaxin Island Reservation | 54 |
| Cocopah Tribe of Arizona | 53 |
| Mashantucket Pequot Indian Tribe | 53 |
| Ouzinkie, Native Village of | 52 |
| Quileute Tribe of the Quileute Reservation | 51 |
| Tejon Indian Tribe | 51 |
| Hoh Indian Tribe | 50 |
| Pascua Yaqui Tribe of Arizona | 49 |
| Quartz Valley Indian Community of the Quartz Valley Reservation of California | 49 |
| Cow Creek Band of Umpqua Tribe of Indians | 46 |
| Yurok Tribe of the Yurok Reservation, California | 45 |
| Cedarville Rancheria, California | 44 |
| Confederated Salish and Kootenai Tribes of the Flathead Reservation | 44 |
| Friends of Iolani Palace | 43 |
| Nelson Lagoon, Native Village of | 42 |
| Naknek Native Village | 38 |
| Fort Bidwell Indian Community of the Fort Bidwell Reservation of California | 37 |
| Twenty-Nine Palms Band of Mission Indians of California | 37 |
| Qagan Tayagungin Tribe of Sand Point Village | 36 |
| Piro-Manso-Tiwa Indian group | 33 |
| Eyak, Native Village of (aka Cordova) | 32 |
| Resighini Rancheria, California | 31 |
| Aloha First | 30 |
| Chenega, Native Village of (aka Chanega) | 30 |
| Tatitlek, Native Village of | 30 |
| Amah Mutsun Tribal Band | 29 |
| Chignik Bay Tribal Council | 26 |
| Chignik Lagoon, Native Village of | 26 |
| Chignik Lake Village | 26 |
| Fernandeno Tataviam Band of Mission Indians | 26 |
| Ivanof Bay Tribe | 26 |
| King Salmon Tribe | 26 |
| Perryville, Native Village of | 26 |
| Pinoleville Pomo Nation, California | 26 |
| Cloverdale Rancheria of Pomo Indians of California | 25 |
| Dry Creek Rancheria Band of Pomo Indians, California | 25 |
| Hopland Band of Pomo Indians, California | 25 |
| Kashia Band of Pomo Indians of the Stewarts Point Rancheria, California | 25 |
| Koi Nation of Northern California | 25 |
| Lytton Rancheria of California | 25 |
| Manchester Band of Pomo Indians of the Manchester Rancheria, California | 25 |
| Potter Valley Tribe, California | 25 |
| Redwood Valley or Little River Band of the Redwood Valley Rancheria California | 25 |
| Robinson Rancheria | 25 |
| South Naknek Village | 25 |
| Teller, Native Village of | 25 |
| Afognak, Native Village of | 24 |
| Port Lions, Native Village of | 24 |
| Kaktovik Village (aka Barter Island) | 23 |
| Kenaitze Indian Tribe | 23 |
| Central Council of the Tlingit and Haida Indian Tribes | 22 |
| Wampanoag Repatriation Confederation | 22 |
| Tanana, Native Village of | 21 |
| Chitina, Native Village of | 20 |
| Ounalashka Corporation | 20 |
| Shaktoolik, Native Village of | 20 |
| Stony River, Village of | 20 |
| Atka, Native Village of | 19 |
| Big Lagoon Rancheria, California | 19 |
| Akutan, Native Village of | 18 |
| Kaiwi Olelo O'Hawaii | 18 |
| Karluk, Native Village of | 18 |
| Kootznoowoo Incorporated | 18 |
| Pu'uhonua O Waimanalo | 18 |
| Akhiok, Native Village of | 17 |
| Cahto Tribe of the Laytonville Rancheria | 17 |
| Clatsop-Nehalem Confederated Tribes | 17 |
| Karuk Tribe | 17 |
| Snoqualmoo Tribe | 17 |
| Coyote Valley Band of Pomo Indians of California | 16 |
| Kokhanok Village | 16 |
| Muwekma Ohlone Tribe | 16 |
| Agdaagux Tribe of King Cove | 15 |
| Belkofski, Native Village of | 15 |
| Hoopa Valley Tribe, California | 15 |
| Koyukuk Native Village | 15 |
| Leisnoi, Inc. | 15 |
| Mentasta Lake Traditional Council | 15 |
| Nation of Hawaii | 15 |
| Natives of Kodiak, Inc. | 15 |
| Pauloff Harbor Village | 15 |
| Royal Hawaiian Academy of Traditional Arts | 15 |
| Unga, Native Village of | 15 |
| Koa Mana | 14 |
| Big Valley Band of Pomo Indians of the Big Valley Rancheria, California | 13 |
| Afognak Native Corporation | 12 |
| Habematolel Pomo of Upper Lake, California | 12 |
| Inupiat Community of the Arctic Slope | 12 |
| Nome Eskimo Community | 12 |
| Sherwood Valley Rancheria of Pomo Indians of California | 12 |
| Ambler, Native Village of | 11 |
| Akhiok-Kaguyak, Inc. | 10 |
| Togiak, Traditional Village of | 9 |
| Wukchumni Tribe of Yokut Indians | 9 |
| Yowlumne Tejon Indians | 9 |
| Aleut Corporation | 8 |
| Anvik Village | 8 |
| First Nation of New Hampshire | 8 |
| Kake, Organized Village of | 8 |
| Kivalina, Native Village of | 8 |
| Ouzinkie Native Corporation | 8 |
| San Fernando Band of Mission Indians | 8 |
| Sitka Tribe of Alaska | 8 |
| Yakutat Tlingit Tribe | 8 |
| Klawock Cooperative Association | 7 |
| Mohawk Nation Council of Chiefs | 7 |
| Ninilchik Village | 7 |
| Petersburg Indian Association | 7 |
| Knik Tribe | 6 |
| Tinoqui-Chalola Council of Kitanemuk | 6 |
| Wrangell Cooperative Association | 6 |
| Aha Moku Advisory Committee (Moku o Keawe) | 5 |
| Brevig Mission, Native Village of | 5 |
| Bristol Bay Native Corporation | 5 |
| Cook Inlet Region, Inc. | 5 |
| Hawaiian Civic Club of Ka'u | 5 |
| Kaguyak Village | 5 |
| Noorvik Native Community | 5 |
| Northway Village | 5 |
| Salamatof Tribe | 5 |
| Tanacross, Native Village of | 5 |
| Unalakleet, Native Village of | 5 |
| Yupiit of Andreafski | 5 |
| Anaktuvak Pass, Village of | 4 |
| Arctic Slope Regional Corporation | 4 |
| Goodnews Bay, Native Village of | 4 |
| Nenana Native Association | 4 |
| Orutsararmiut Traditional Native Council | 4 |
| Pribilof Islands Aleut Communities of St. Paul and St. George Islands | 4 |
| Tangirnaq Native Village | 4 |
| Atxam Corporation | 3 |
| Ayakulik, Inc. | 3 |
| Cheroenhaka (Nottoway) Indian Tribe | 3 |
| Diomede (aka Inalik), Native Village of | 3 |
| Hawaiian Genealogy Society | 3 |
| Hoonah Indian Association | 3 |
| Hooper Bay, Native Village of | 3 |
| King Island Native Community | 3 |
| Litnik, Inc. | 3 |
| Mattaponi Indian Tribe | 3 |
| Na Pali Coast 'Ohana | 3 |
| Native Hawaiian Advisory Council | 3 |
| Nottoway Indian Tribe of Virginia | 3 |
| Nuiqsut, Native Village of (aka Nooiksut) | 3 |
| Nulato Village | 3 |
| Pa Ku'i-a-lua | 3 |
| Patawomeck Indian Tribe of Virginia | 3 |
| Platinum Traditional Village | 3 |
| Punalu'u Preservation Association | 3 |
| Upper Mattaponi Indian Tribe | 3 |
| Uyak, Inc. | 3 |
| Wainwright, Village of | 3 |
| Wales, Native Village of | 3 |
| Apache Business Committee | 2 |
| Atqasuk, Native Village | 2 |
| Bell Flats Natives, Inc. | 2 |
| Bering Straits Native Corporation | 2 |
| Calista Corporation | 2 |
| Cape Fox Corporation | 2 |
| Chaluka Corporation | 2 |
| Chinik Eskimo Community (Golovin) | 2 |
| Chinook Tribe | 2 |
| Council, Native Village of | 2 |
| Douglas Indian Association | 2 |
| Eagle, Native Village of | 2 |
| Elim, Native Village of | 2 |
| False Pass, Native Village of | 2 |
| Hassanamisco Band | 2 |
| Hui Kako'o | 2 |
| Hydaburg Cooperative Association | 2 |
| Inter-Tribal Council of Nevada | 2 |
| Kiana, Native Village of | 2 |
| Kootenai Tribe of Idaho | 2 |
| Koyuk, Native Village of | 2 |
| Mary's Igloo, Native Village of | 2 |
| Mojave Apache Community Council | 2 |
| Point Lay, Native Village of | 2 |
| Shishmaref, Native Village of | 2 |
| Shuyak, Inc. | 2 |
| Solomon, Village of | 2 |
| St. Michael, Native Village of | 2 |
| Stebbins Community Association | 2 |
| Uganik Natives, Inc. | 2 |
| White Mountain, Native Village of | 2 |
| Yazapai-Apache Community Council | 2 |
| Aleknagik, Native Village of | 1 |
| Anton Larsen, Inc. | 1 |
| Brevig Mission Native Corporation | 1 |
| Burt Lake Band of Ottawa and Chippewa Indians | 1 |
| Chilkat Indian Village (Klukwan) | 1 |
| Chilkoot Indian Association (Haines) | 1 |
| Coleville Onadika (Salt Eaters) in Antelope Valley | 1 |
| Curyung Tribal Council | 1 |
| Doyon, Ltd. | 1 |
| Duwamish Tribe | 1 |
| Egegik Village | 1 |
| Ekuk, Native Village of | 1 |
| Ekwok, Native Village of | 1 |
| Galena Village (aka Louden Village) | 1 |
| Holy Cross Tribe | 1 |
| Igiugig Village | 1 |
| Kasaan, Organized Village of | 1 |
| Kikiallus Nation | 1 |
| Levelock Village | 1 |
| Manokotak Village | 1 |
| Marietta Band of Nooksack Indians | 1 |
| McGrath Native Village | 1 |
| Mekoryuk, Native Village of | 1 |
| Miakan-Garza Band of the Coahuiltecan people | 1 |
| Mono Lake Kutzadika Indian Community | 1 |
| NANA Regional Corporation | 1 |
| New Koliganek Village Council | 1 |
| New Stuyahok Village | 1 |
| Newhalen Village | 1 |
| Noatak, Native Village of | 1 |
| Nondalton Village | 1 |
| Pedro Bay Village | 1 |
| Pilot Point, Native Village of | 1 |
| Port Heiden, Native Village of | 1 |
| Portage Creek Village (aka Ohgsenakale) | 1 |
| San Luis Rey Band of Mission Indians | 1 |
| Snohomish Tribe | 1 |
| Steilacoom Indian Tribe | 1 |
| Tanadgusix Corporation | 1 |
| Teller Native Corporation | 1 |
| Tigara Corporation | 1 |
| Tubatulabals of Kern Valley | 1 |
| Unkechaug Indian Nation | 1 |
| Wales Native Corporation | 1 |
Know how an institution is handling repatriation? Have a personal story to share? We'd like to hear from you.
Watch an informational webinar with our reporters.
This tool presents a dataset maintained by the National Park Service containing all the Native American human remains and associated funerary objects that institutions have reported to the federal government under the Native American Graves Protection and Repatriation Act. The dataset includes information about the state and county where remains and objects were taken from, which institutions hold them and whether they have been made available for return to tribes.
The data is self-reported by institutions. The amount of unrepatriated Native American remains reported by institutions is a minimum estimate of individuals and institutions frequently adjust these numbers when they reinventory groups of remains. Some institutions that are subject to NAGPRA have also entirely failed to report the remains in their possession. As a result, the numbers provided are best taken as estimates. The actual number and geographic scope of what’s held by publicly funded institutions is larger than what is presently documented.
ProPublica supplemented this dataset with information about cultural affiliation and disposition to specific tribes by systematically parsing the text of Notices of Inventory Completion published in the Federal Register. An additional dataset from the Department of Housing and Urban Development, the Tribal Directory Assessment Tool, was used for the section on remains not made available for return from counties that each tribe has indicated interest in to the federal government.
Institution location and tribal headquarters location information was provided by National NAGPRA. The location of some groups that are not federally recognized was provided through research by ProPublica.
Institutions that are part of a larger entity are grouped. (For example, the Mesa Verde National Park is part of the U.S. Department of the Interior.)
Institutions that have not submitted information to the federal government are not listed. The Smithsonian Institution is not listed because its repatriation process falls under the National Museum of the American Indian Act and it is not required to publicly report its holdings with the same detail as institutions subject to NAGPRA.
If you work for an institution and would like to provide comment on your institution’s repatriation efforts, please email [email protected]. If you think the data is incorrect or have a data request, please get in touch. We are aware of some issues with the accuracy of location information and tribes mistakenly being identified for disposition of Native American remains in published notices.
If you want to share something else with ProPublica, we’d like to hear from you.
If you have questions about implementing or complying with the Native American Graves Protection and Repatriation Act, get in touch with National NAGPRA or the NAGPRA Community of Practice.
We use the word “tribes” to refer to all groups that institutions made Native American remains available to under NAGPRA. This includes tribes, nations, bands, pueblos, communities, Native Alaskan villages, Native Hawaiian organizations and non-federally recognized groups.
Data sources from Department of the Interior, National Park Service, National NAGPRA Program, the Federal Register, Department of Housing and Development, Tribal Directory Assessment Tool
Images by Roberto Machado Noa/LightRocket via Getty Images, Daderot via Wikimedia, Department of the Interior, and Justin Katigbak for ProPublica.